Fig. 2.
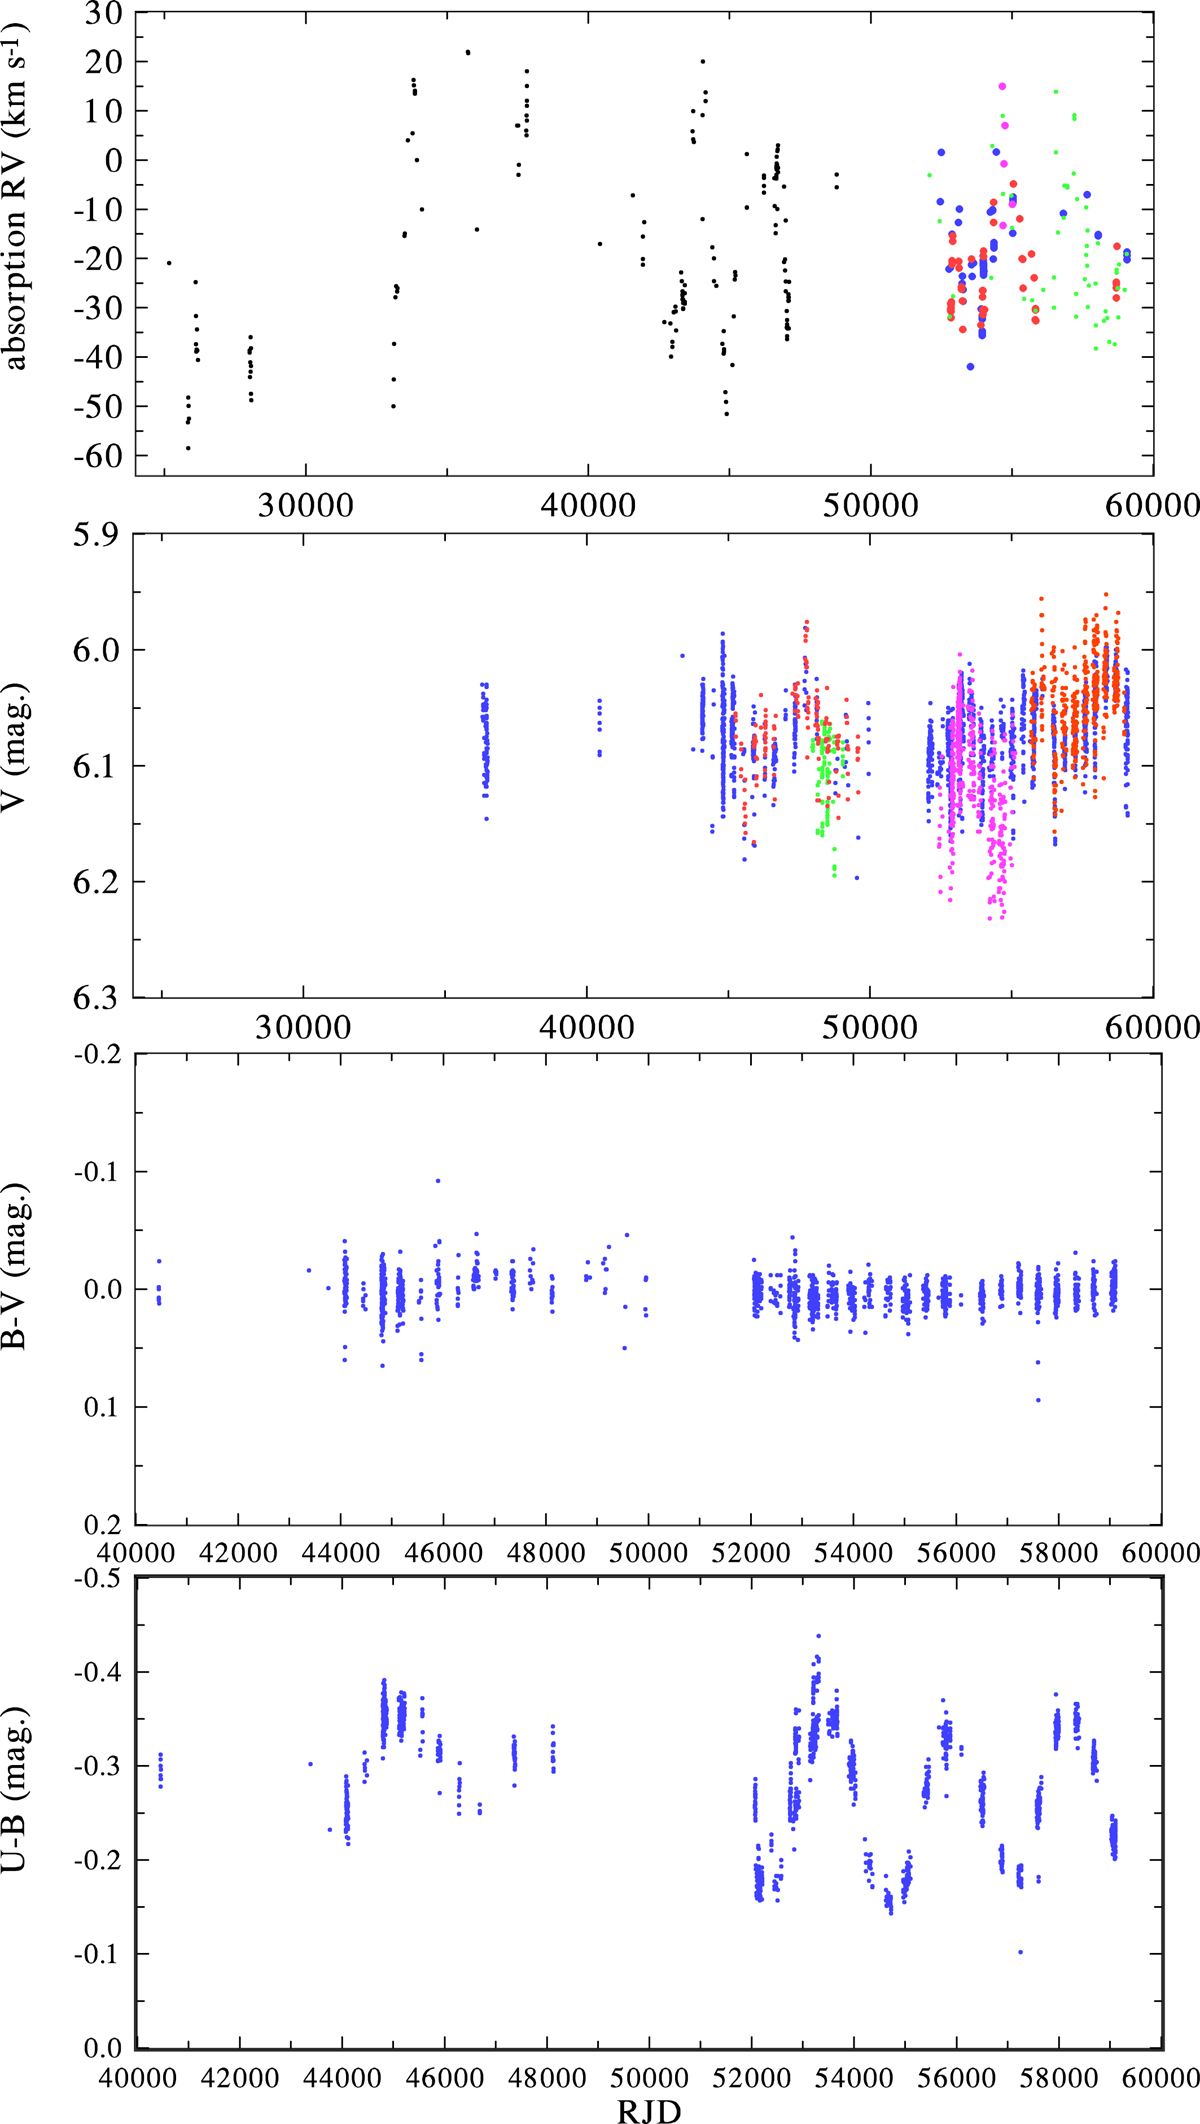
Time evolution of absorption RV (mean RV from the literature, and the Hα core RV for all the new spectra at our disposal), the V magnitude, and B − V, and U − B colour indices over the whole time interval covered by available observations. In the RV plot, black dots show the RVs from the literature, blue circles are from our high signal-to-noise (S/N) spectra, red ones from OND spectra, and green ones from the BeSS spectra. In panels with photometry, blue dots denote calibrated UBV values, red the y magnitude of the Strömgren system, green the HIPPARCOSHp magnitudes transformed to Johnson V, magenta the ASAS3 V magnitude, and brown the KWS V magnitude. We note the shorter time interval covered by the observed colour changes.
Current usage metrics show cumulative count of Article Views (full-text article views including HTML views, PDF and ePub downloads, according to the available data) and Abstracts Views on Vision4Press platform.
Data correspond to usage on the plateform after 2015. The current usage metrics is available 48-96 hours after online publication and is updated daily on week days.
Initial download of the metrics may take a while.