Fig. B.2.
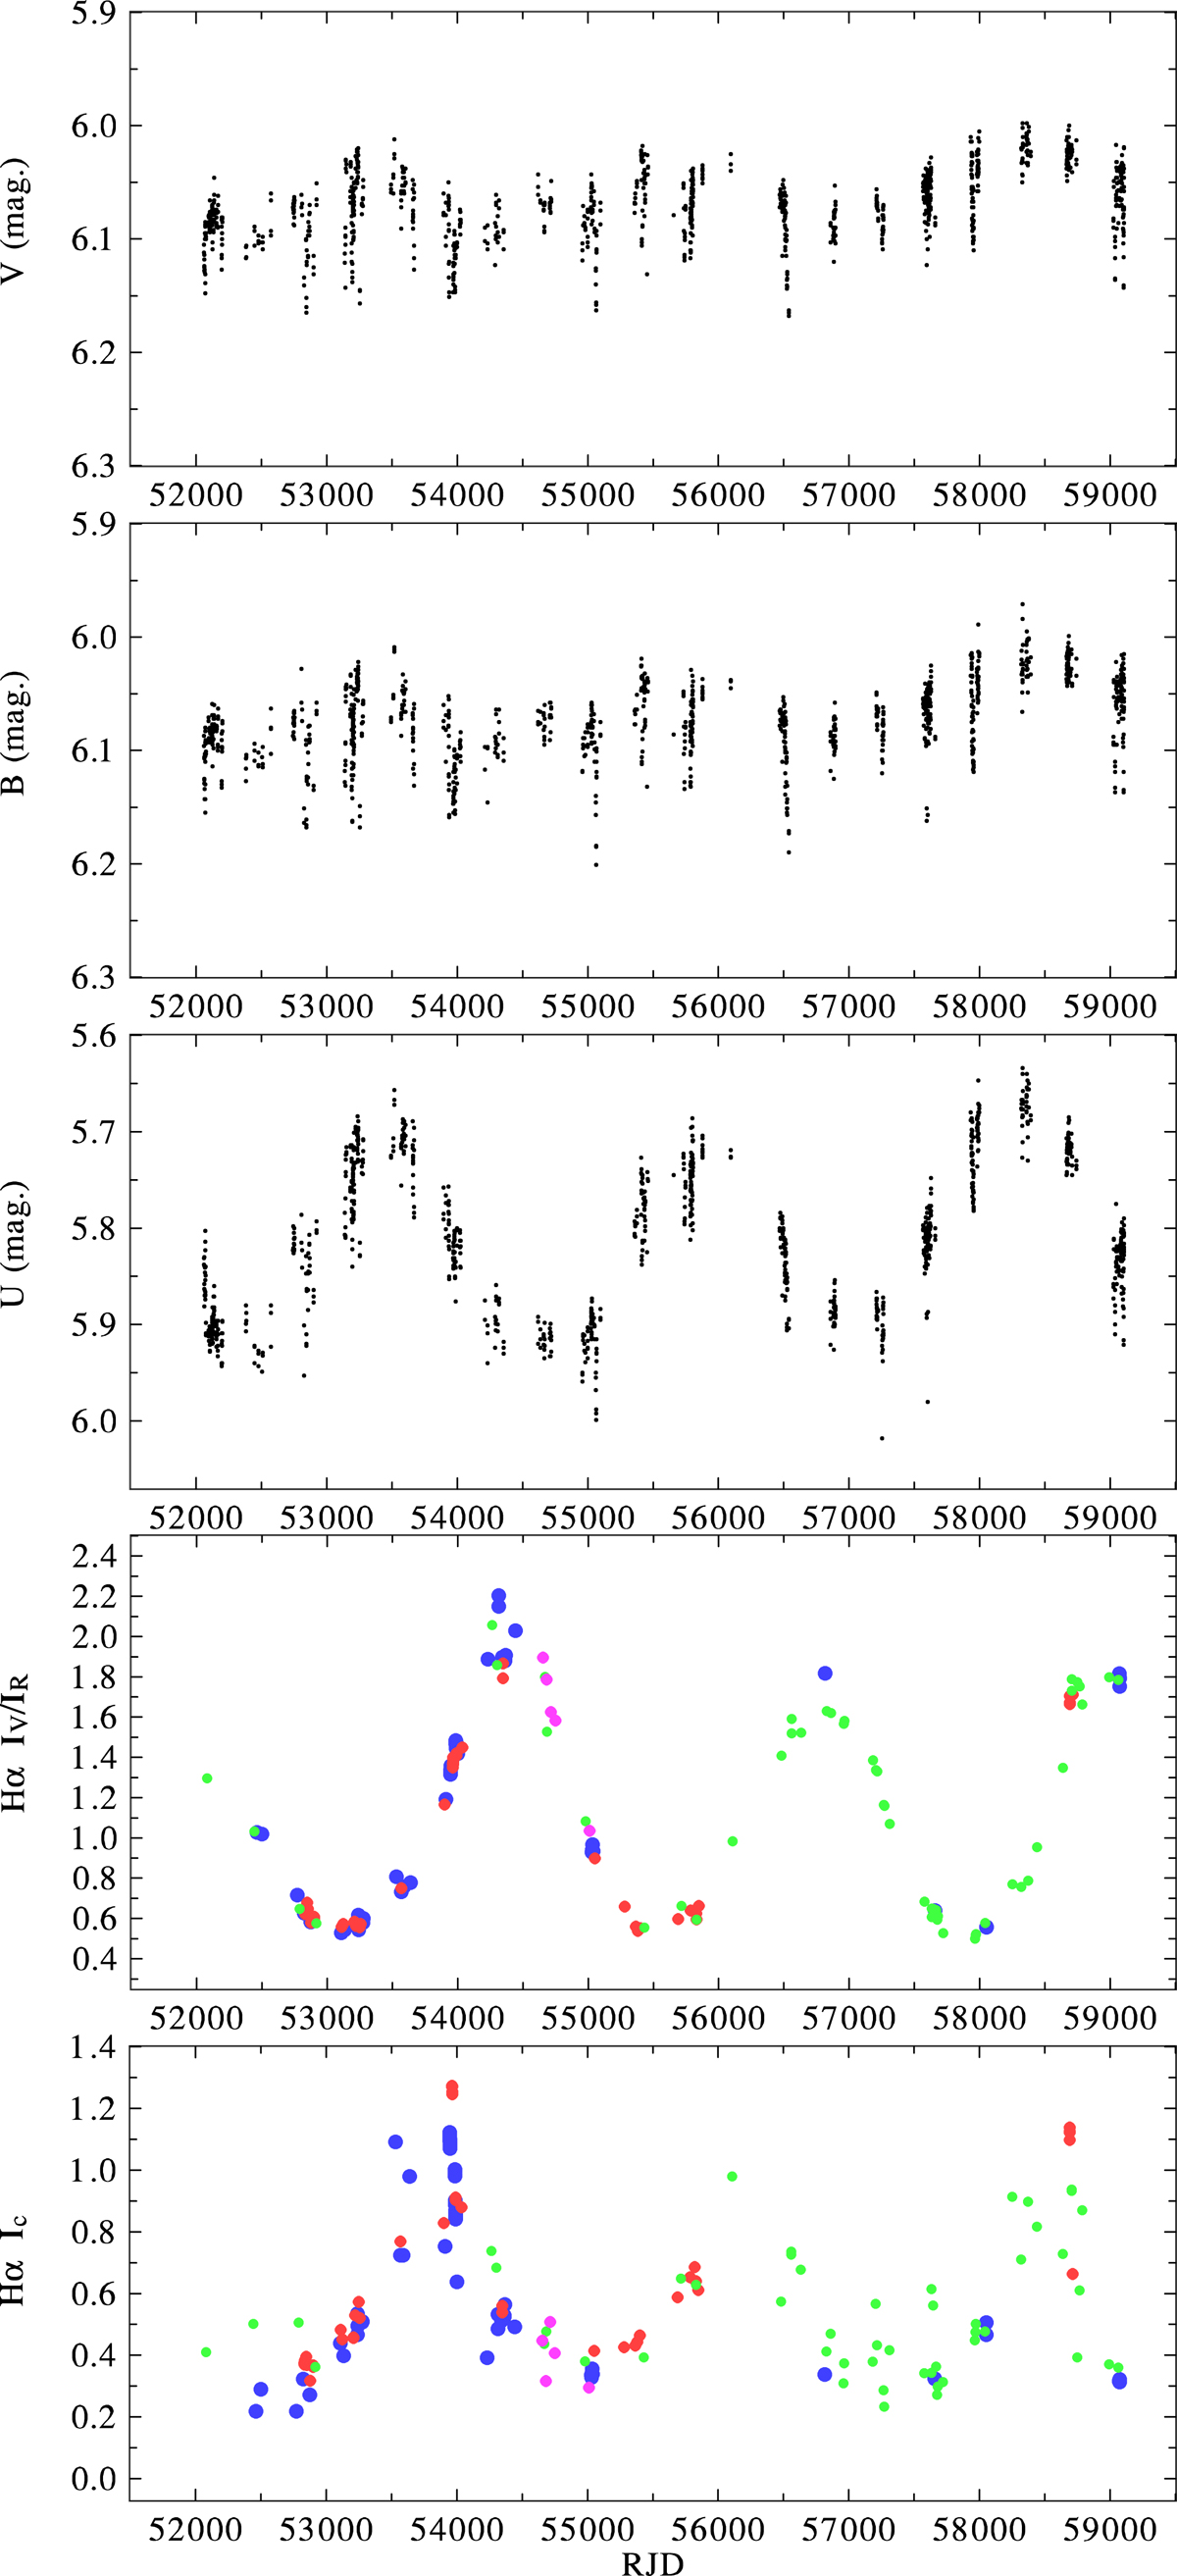
Time evolution of calibrated UBV photometry from stations 1, 20, and 30 (black), and Hα spectrophotometry (V/R and Ic) over a limited time interval RJD 51500 to 59500, which is covered by electronic spectra. Data from the higher-resolution Elodie, Feros, and DAO are shown by blue circles, those from OND by the red circles, those from the BeSS amateur spectra by the green circles, those from the Trieste spectra re-reduced by us by magenta circles.
Current usage metrics show cumulative count of Article Views (full-text article views including HTML views, PDF and ePub downloads, according to the available data) and Abstracts Views on Vision4Press platform.
Data correspond to usage on the plateform after 2015. The current usage metrics is available 48-96 hours after online publication and is updated daily on week days.
Initial download of the metrics may take a while.