Fig. B.1.
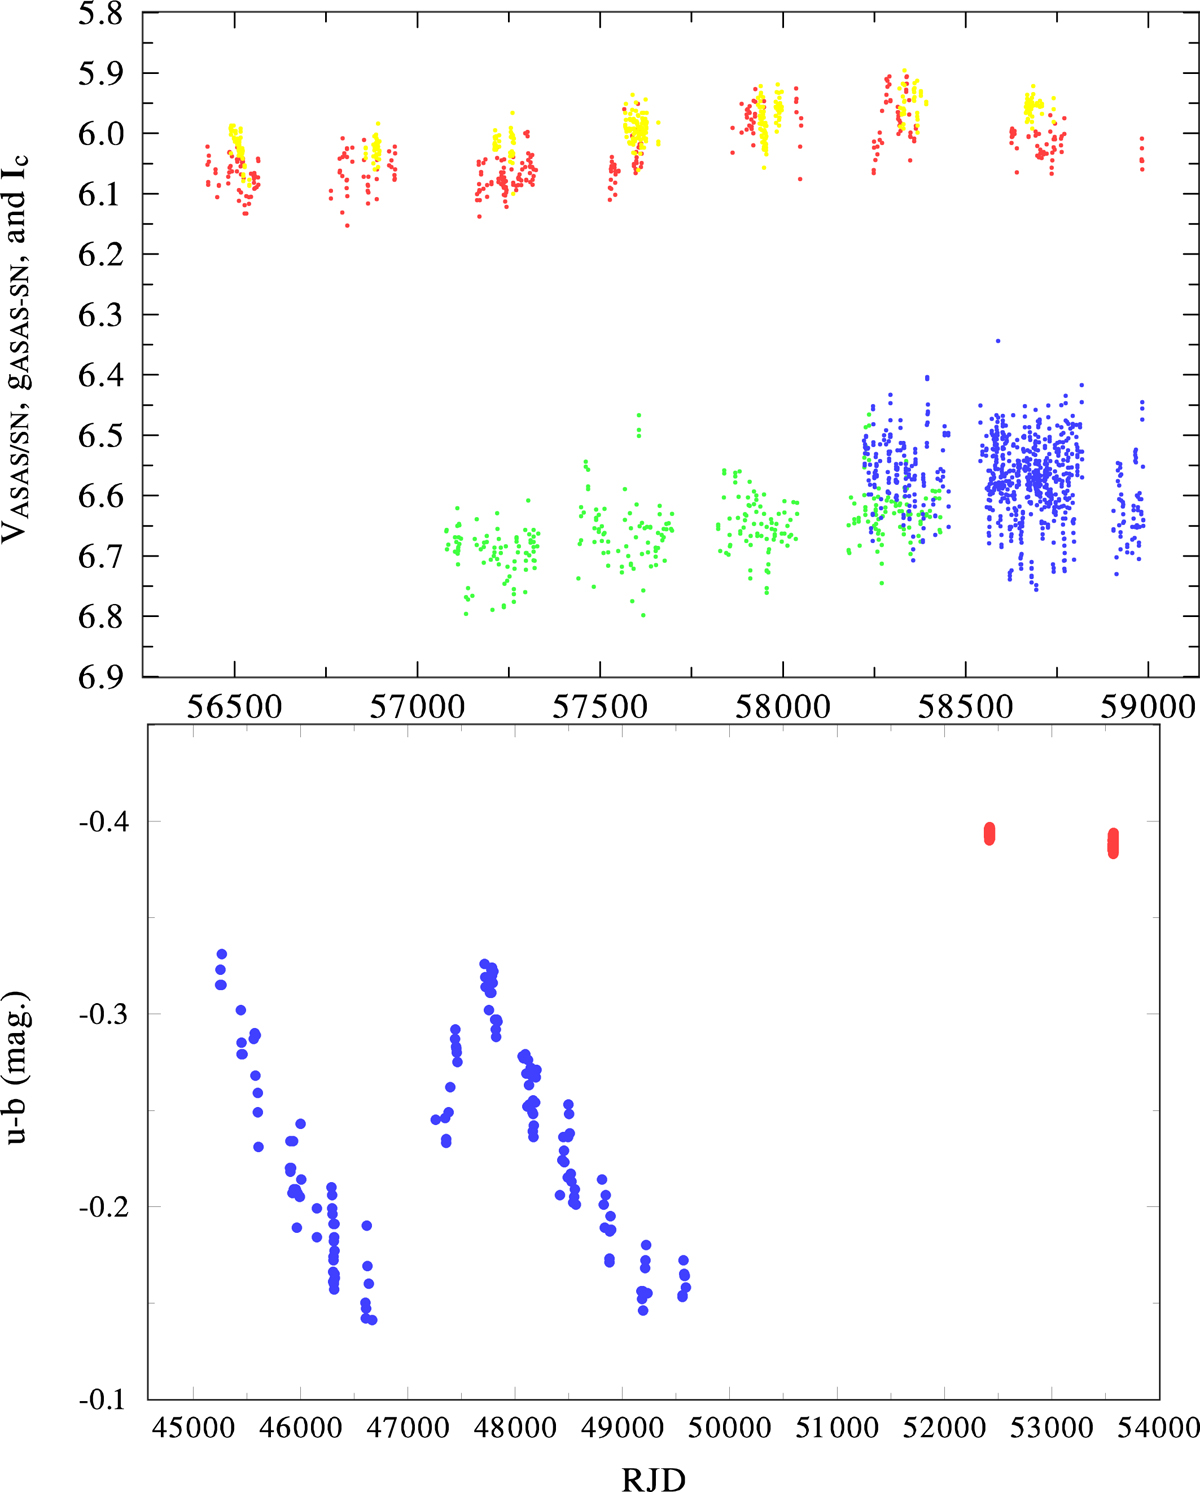
Time evolution of various photometric observations in different passbands. Top: green dots denote the ASAS-SN V magnitude (which is for some 0m.5 fainter than the usual Johnson V magnitude, blue dots denote the ASAS-SN g filter observations, red dots denote the KWS Cousins’ Ic observations, and yellow dots denote Hvar Johnson R observations. Bottom: stromgren u − b index from ESO observations (blue) and from Sierra Nevada differential photometry (red). The data generally confirm the long-term trends seen in the UBV photometry (cf. Fig. 2), but with different amplitude and scatter.
Current usage metrics show cumulative count of Article Views (full-text article views including HTML views, PDF and ePub downloads, according to the available data) and Abstracts Views on Vision4Press platform.
Data correspond to usage on the plateform after 2015. The current usage metrics is available 48-96 hours after online publication and is updated daily on week days.
Initial download of the metrics may take a while.