Fig. 1.
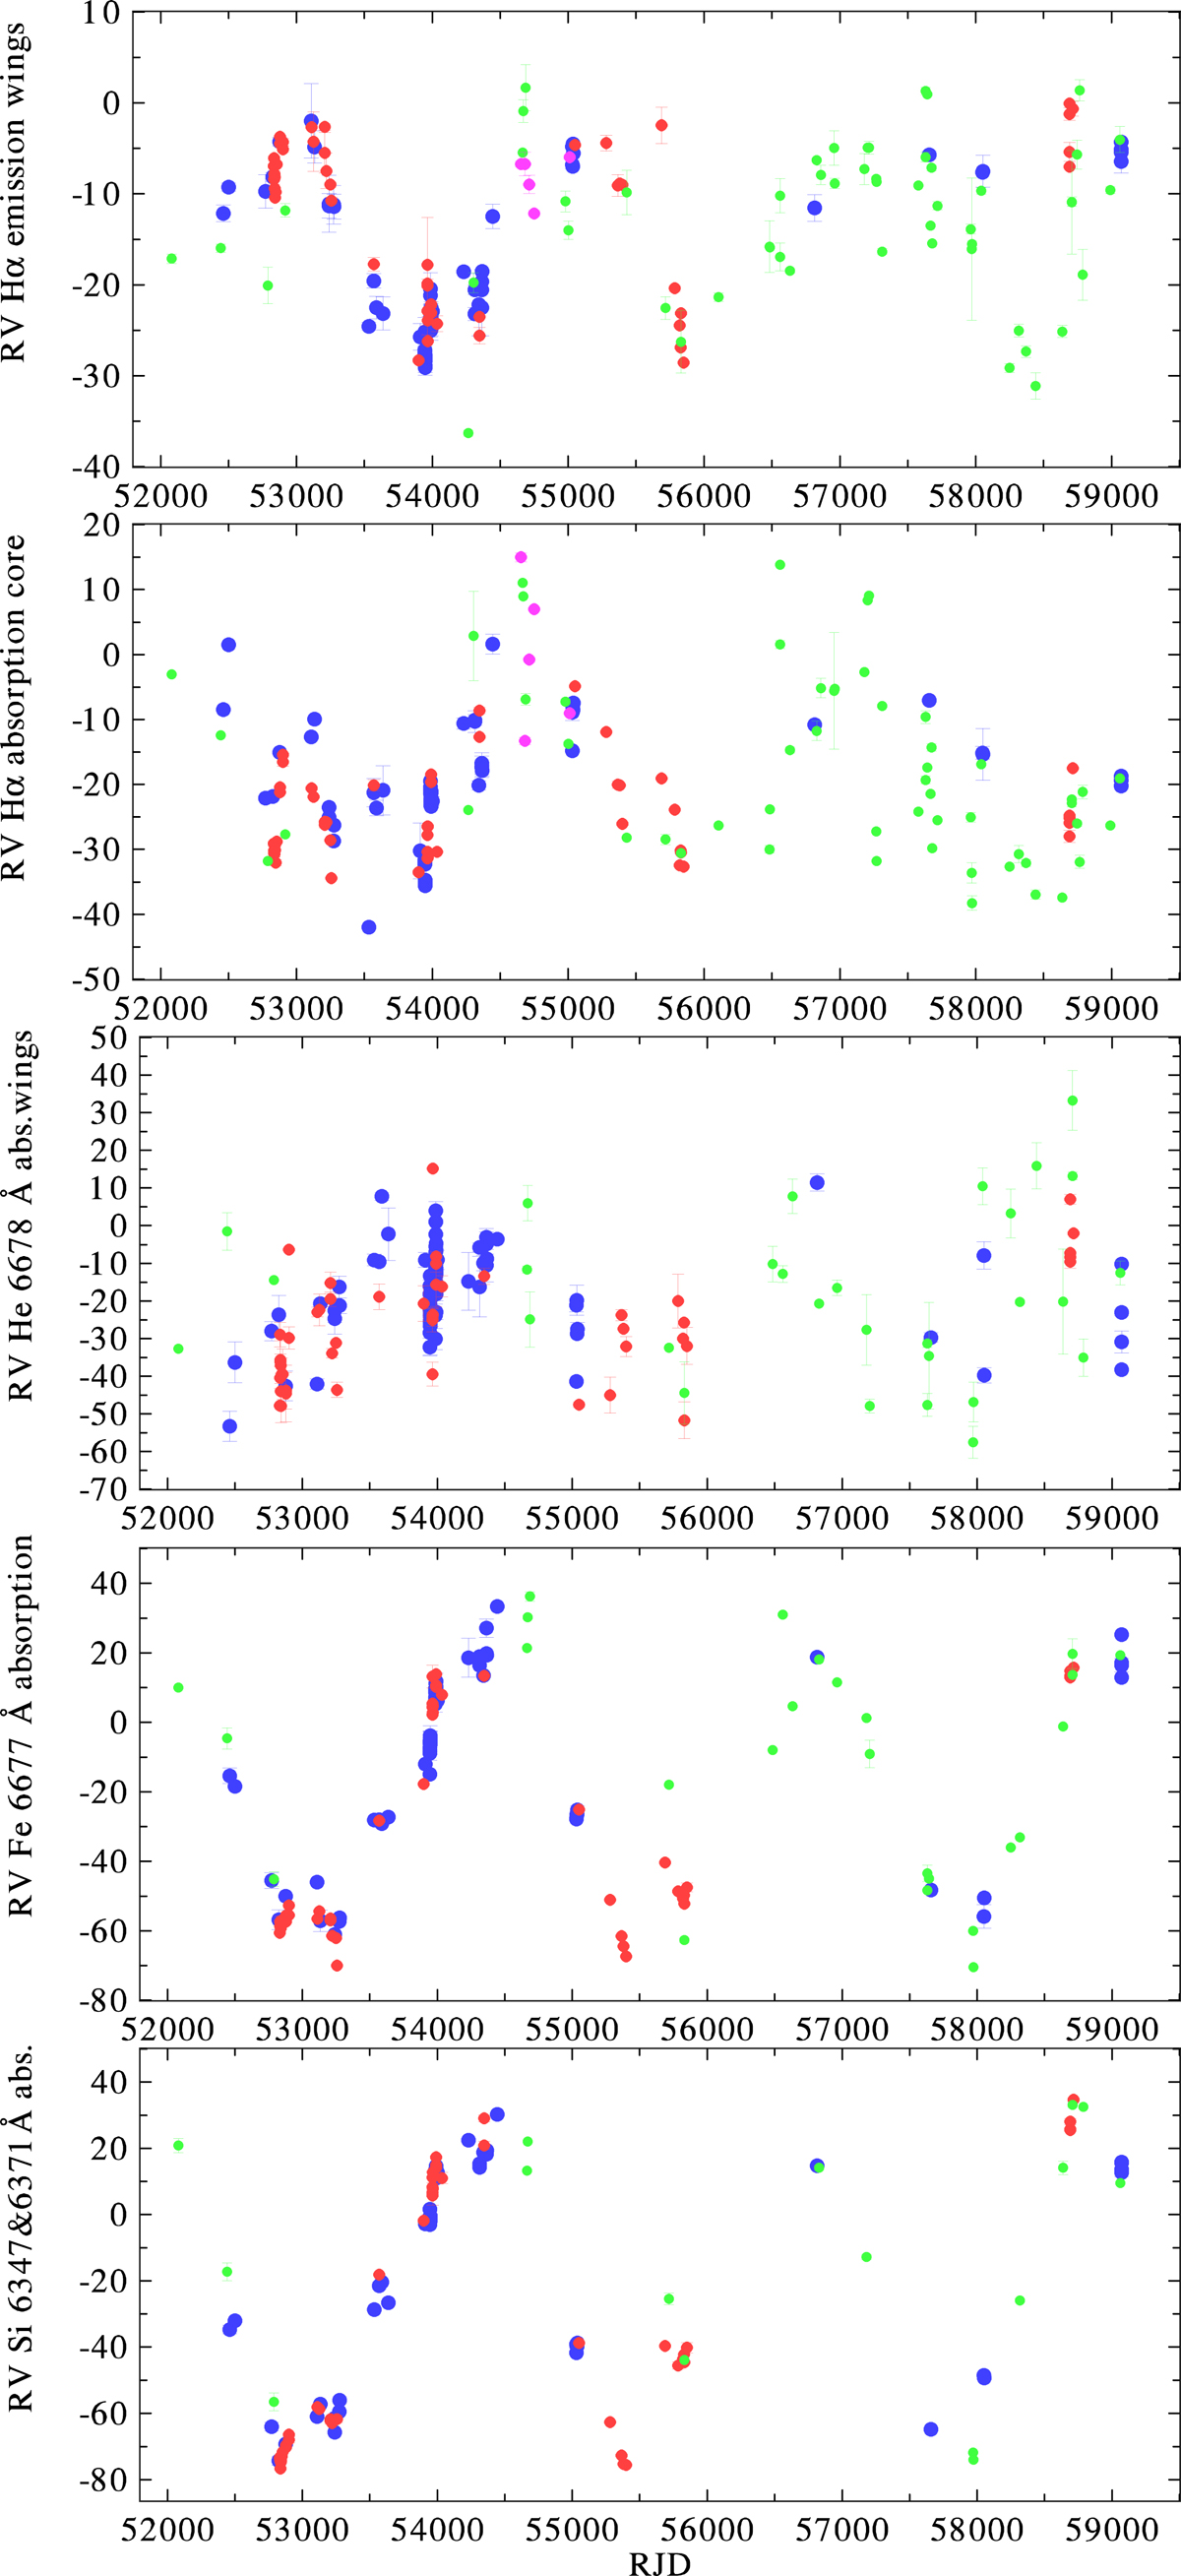
Time plots of RVs (in km s−1) of individual measured features based on our new measurements. From top to bottom: Hα emission wing, Hα absorption core, He 6678 Å absorption wings, Fe II absorption core, and the mean Si II 6347&6371 Å. The RVs taken from the higher-resolution Elodie, Feros, and DAO are shown as blue circles, those from OND in red, those from the BeSS amateur spectra in green, and those from our re-measurements of the Trieste Hα spectra are shown as magenta circles.
Current usage metrics show cumulative count of Article Views (full-text article views including HTML views, PDF and ePub downloads, according to the available data) and Abstracts Views on Vision4Press platform.
Data correspond to usage on the plateform after 2015. The current usage metrics is available 48-96 hours after online publication and is updated daily on week days.
Initial download of the metrics may take a while.