Fig. 9.
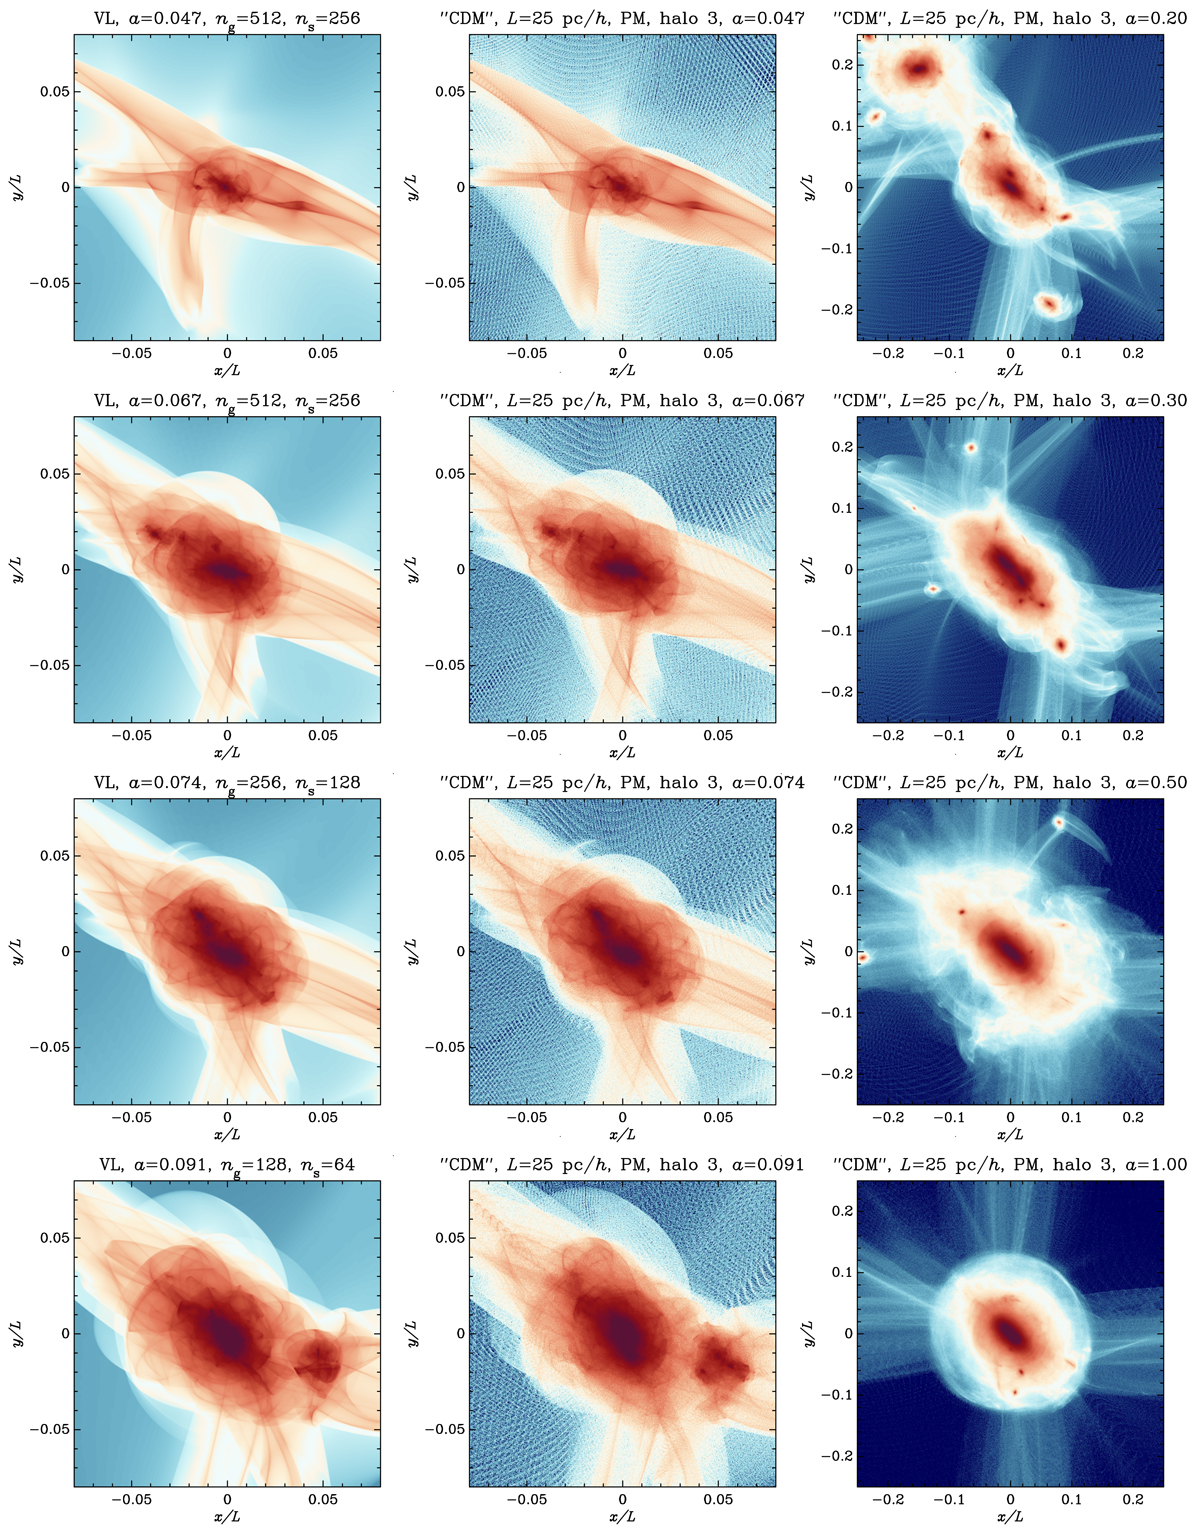
Evolution of total projected density on (x, y) plane for halo 3 of the ‘CDM’ simulations with L = 25 Mpc h−1. This figure is analogous to Fig. 7 except that the times considered here are slightly different and that there is one extra panel in the third column corresponding to present time, a = 1. In the third column of panels, the volume projected is larger in order to have a better view of the various structures at play.
Current usage metrics show cumulative count of Article Views (full-text article views including HTML views, PDF and ePub downloads, according to the available data) and Abstracts Views on Vision4Press platform.
Data correspond to usage on the plateform after 2015. The current usage metrics is available 48-96 hours after online publication and is updated daily on week days.
Initial download of the metrics may take a while.