Fig. 7.
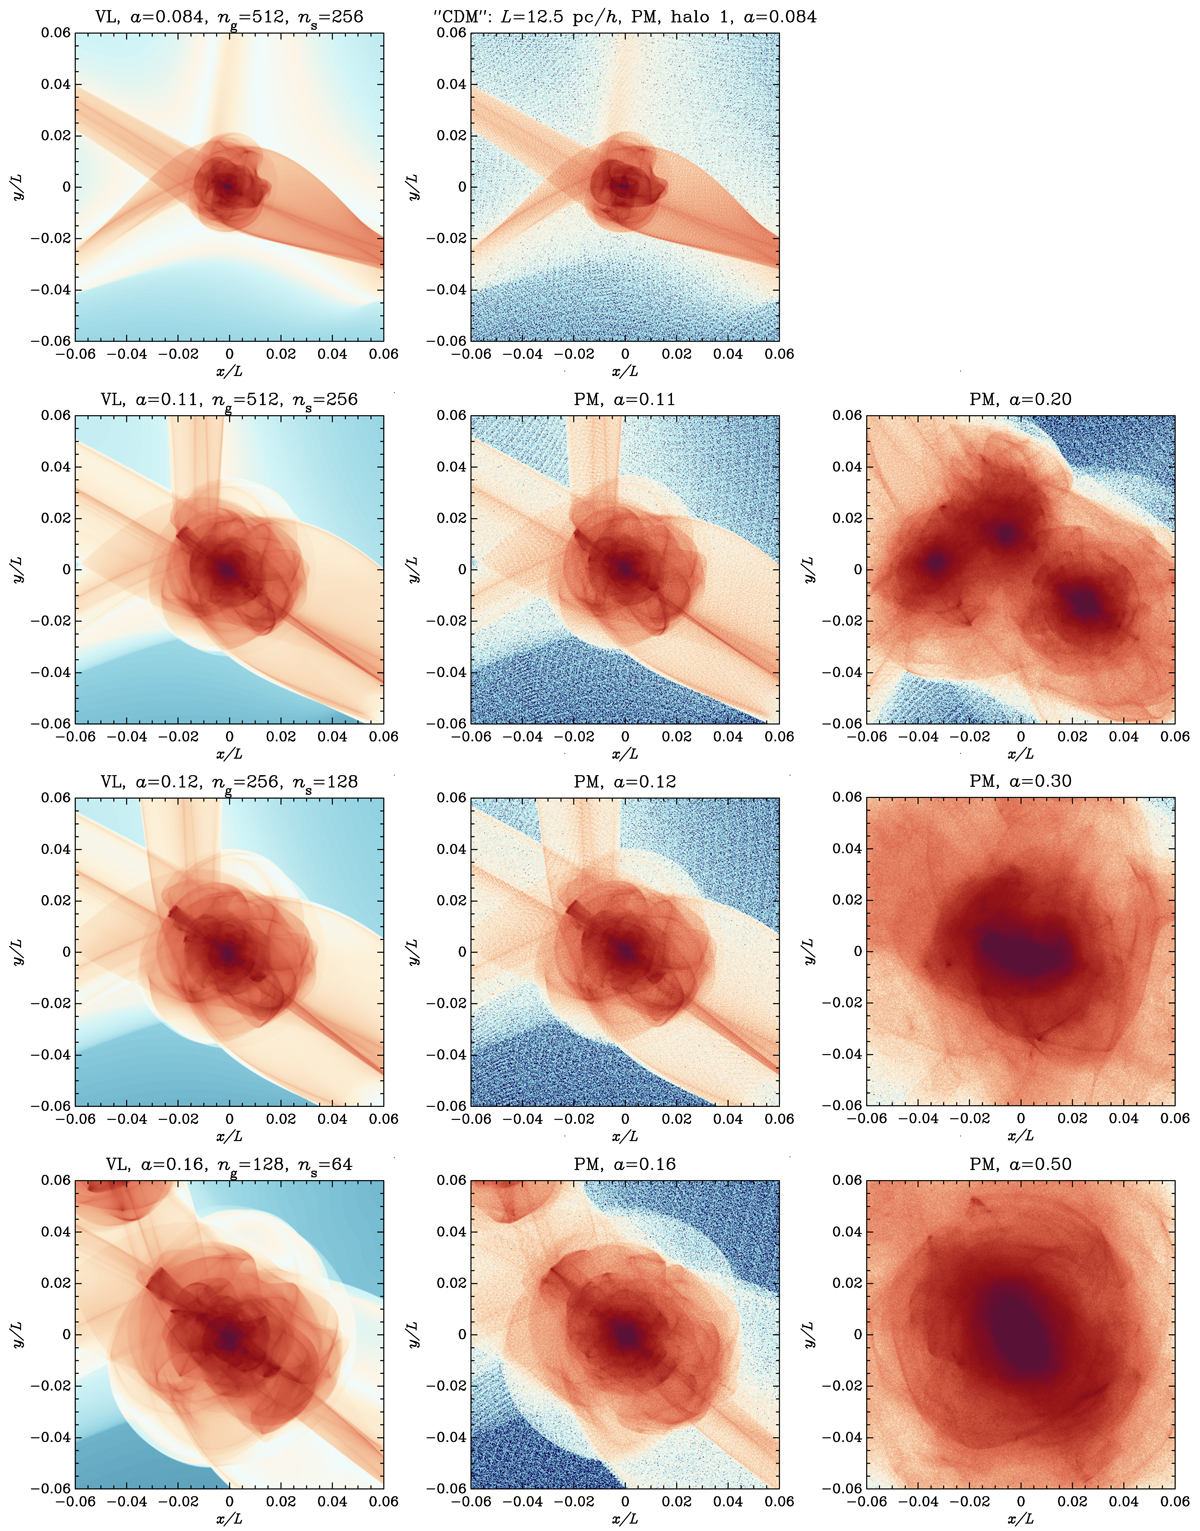
Evolution of total projected density on (x, y) plane for halo 1 of the ‘CDM’ simulations with L = 12.5 Mpc h−1. First column of panels: (from top to bottom) Vlasov runs with expansion factor values a = 0.084, 0.11, 0.12, and 0.16. The two top panels were generated using the highest resolution run with ng = 512, VLA-CDM12.5-HR in Table 1, while the two bottom ones used respectively VLA-CDM12.5-MR with ng = 256 and VLA-CDM12.5-LR with ng = 128. Second column of panels: analogous to the first column, but for the PM simulation, PM-CDM12.5-HR, with ng = 512. Third column of panels: more advanced times in the PM simulation, which highlight a multiple merger (halo 1 can be seen to the right of the top panel in this column). As in Fig. 6, the mass contributing to the projection comes only from the cubical subvolume displayed on each panel.
Current usage metrics show cumulative count of Article Views (full-text article views including HTML views, PDF and ePub downloads, according to the available data) and Abstracts Views on Vision4Press platform.
Data correspond to usage on the plateform after 2015. The current usage metrics is available 48-96 hours after online publication and is updated daily on week days.
Initial download of the metrics may take a while.