Fig. 6.
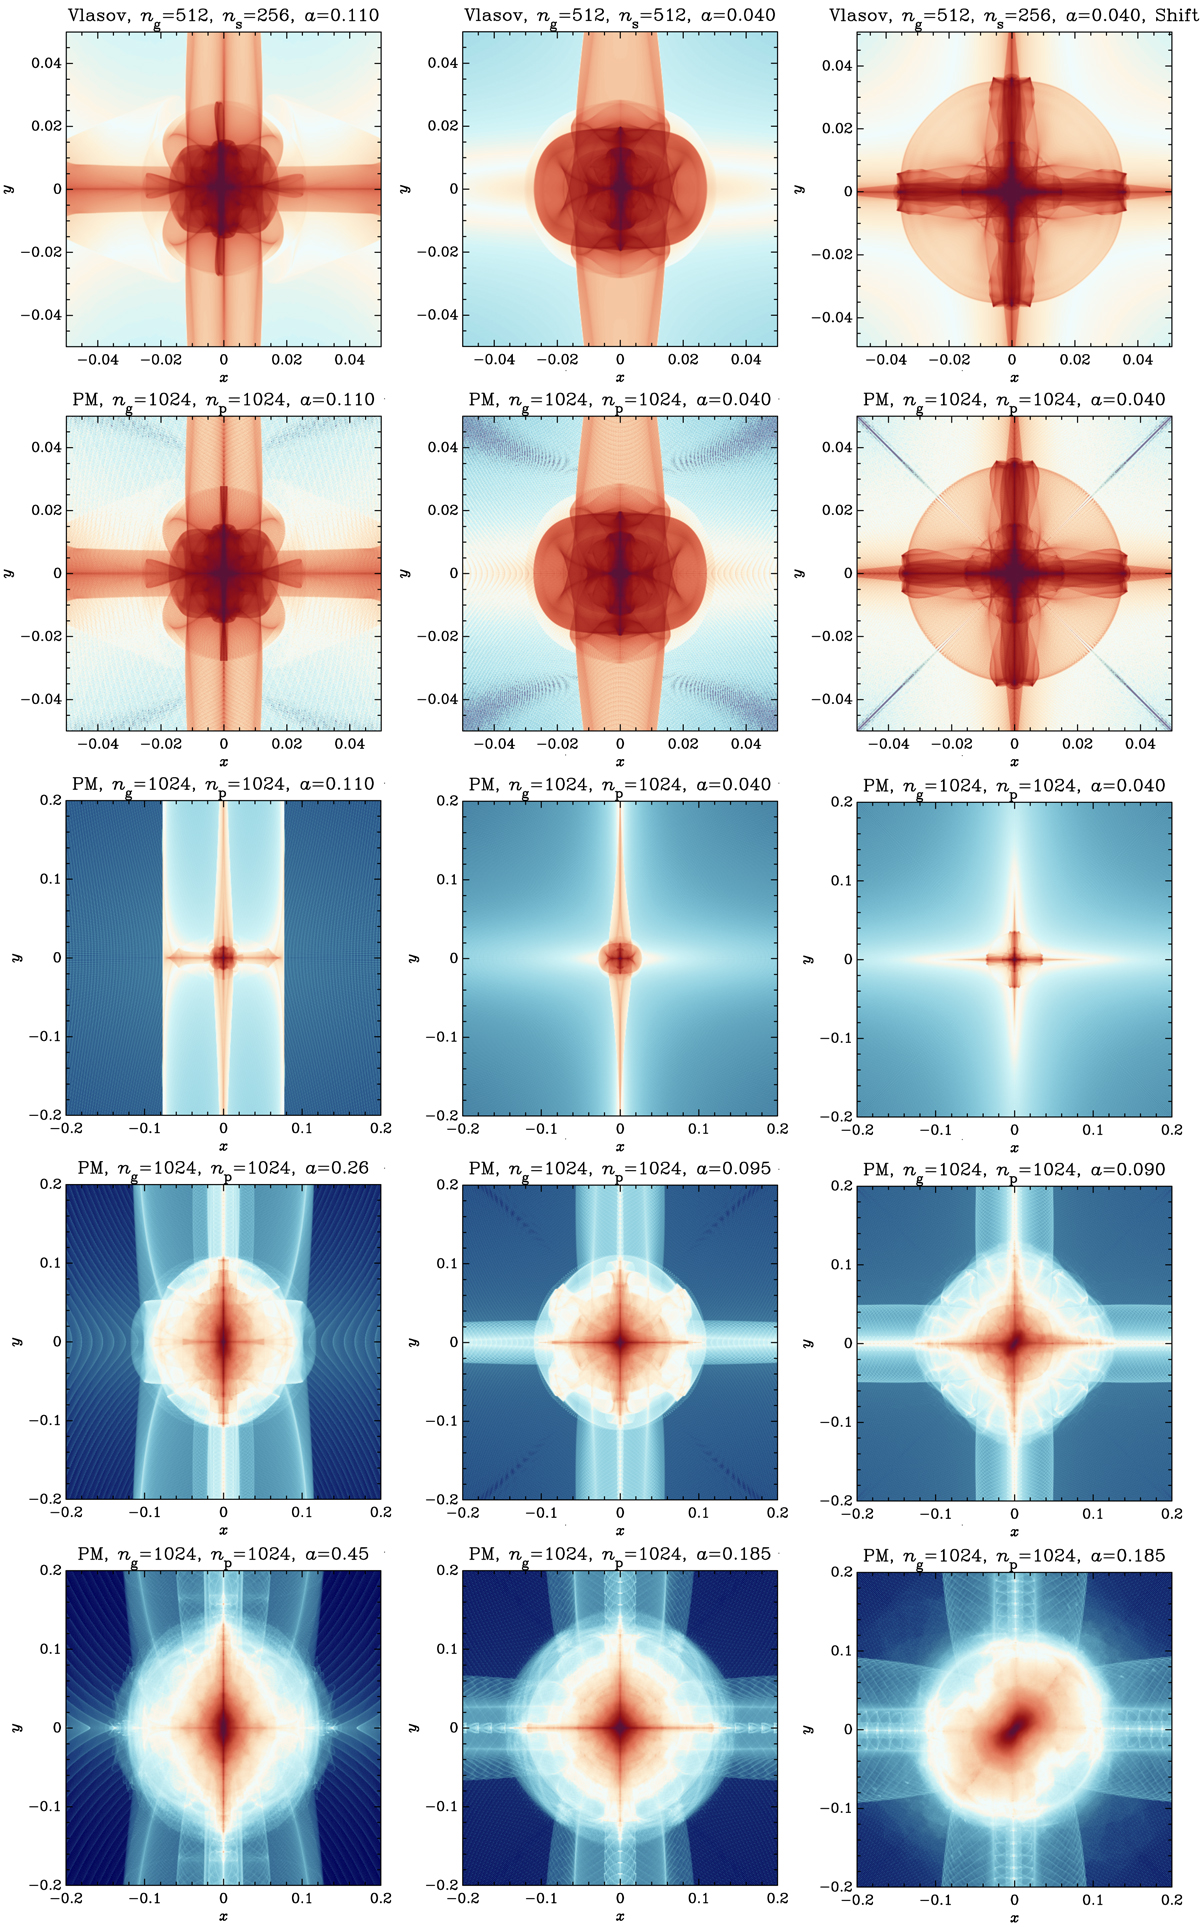
Evolution of total projected density on (x, y) plane for different configurations of the three-sine-wave simulations. Left, middle, and right columns of panels: quasi one-dimensional set-up, ϵ = (1/6, 1/8); anisotropic set-up, ϵ = (3/4, 1/2); and axisymmetric set-up, ϵ = (1, 1), respectively. Top row of panels: results obtained at early time from high resolution Vlasov runs with ng = 512 (VLA-Q1D-HR, VLA-ANI2-FHR, and VLA-SYM-HRS in Table 1), to be compared to the second row of panels, which corresponds to the highest resolution PM runs with ng = np = 1024 (PM-Q1D-UHR, PM-ANI2-UHR, and PM-SYM-UHR). Third row of panels: same as the second row, but for a larger subcube. Last two rows of panels: results obtained from the PM runs at mid and late time. The region displayed is only a fraction of the full simulation size, namely Lsub = L/10 for the four top panels and Lsub = L/2.5 for the six bottom panels. The density contributing to the projection comes only from the cubical subvolume of size Lsub.
Current usage metrics show cumulative count of Article Views (full-text article views including HTML views, PDF and ePub downloads, according to the available data) and Abstracts Views on Vision4Press platform.
Data correspond to usage on the plateform after 2015. The current usage metrics is available 48-96 hours after online publication and is updated daily on week days.
Initial download of the metrics may take a while.