Fig. 5.
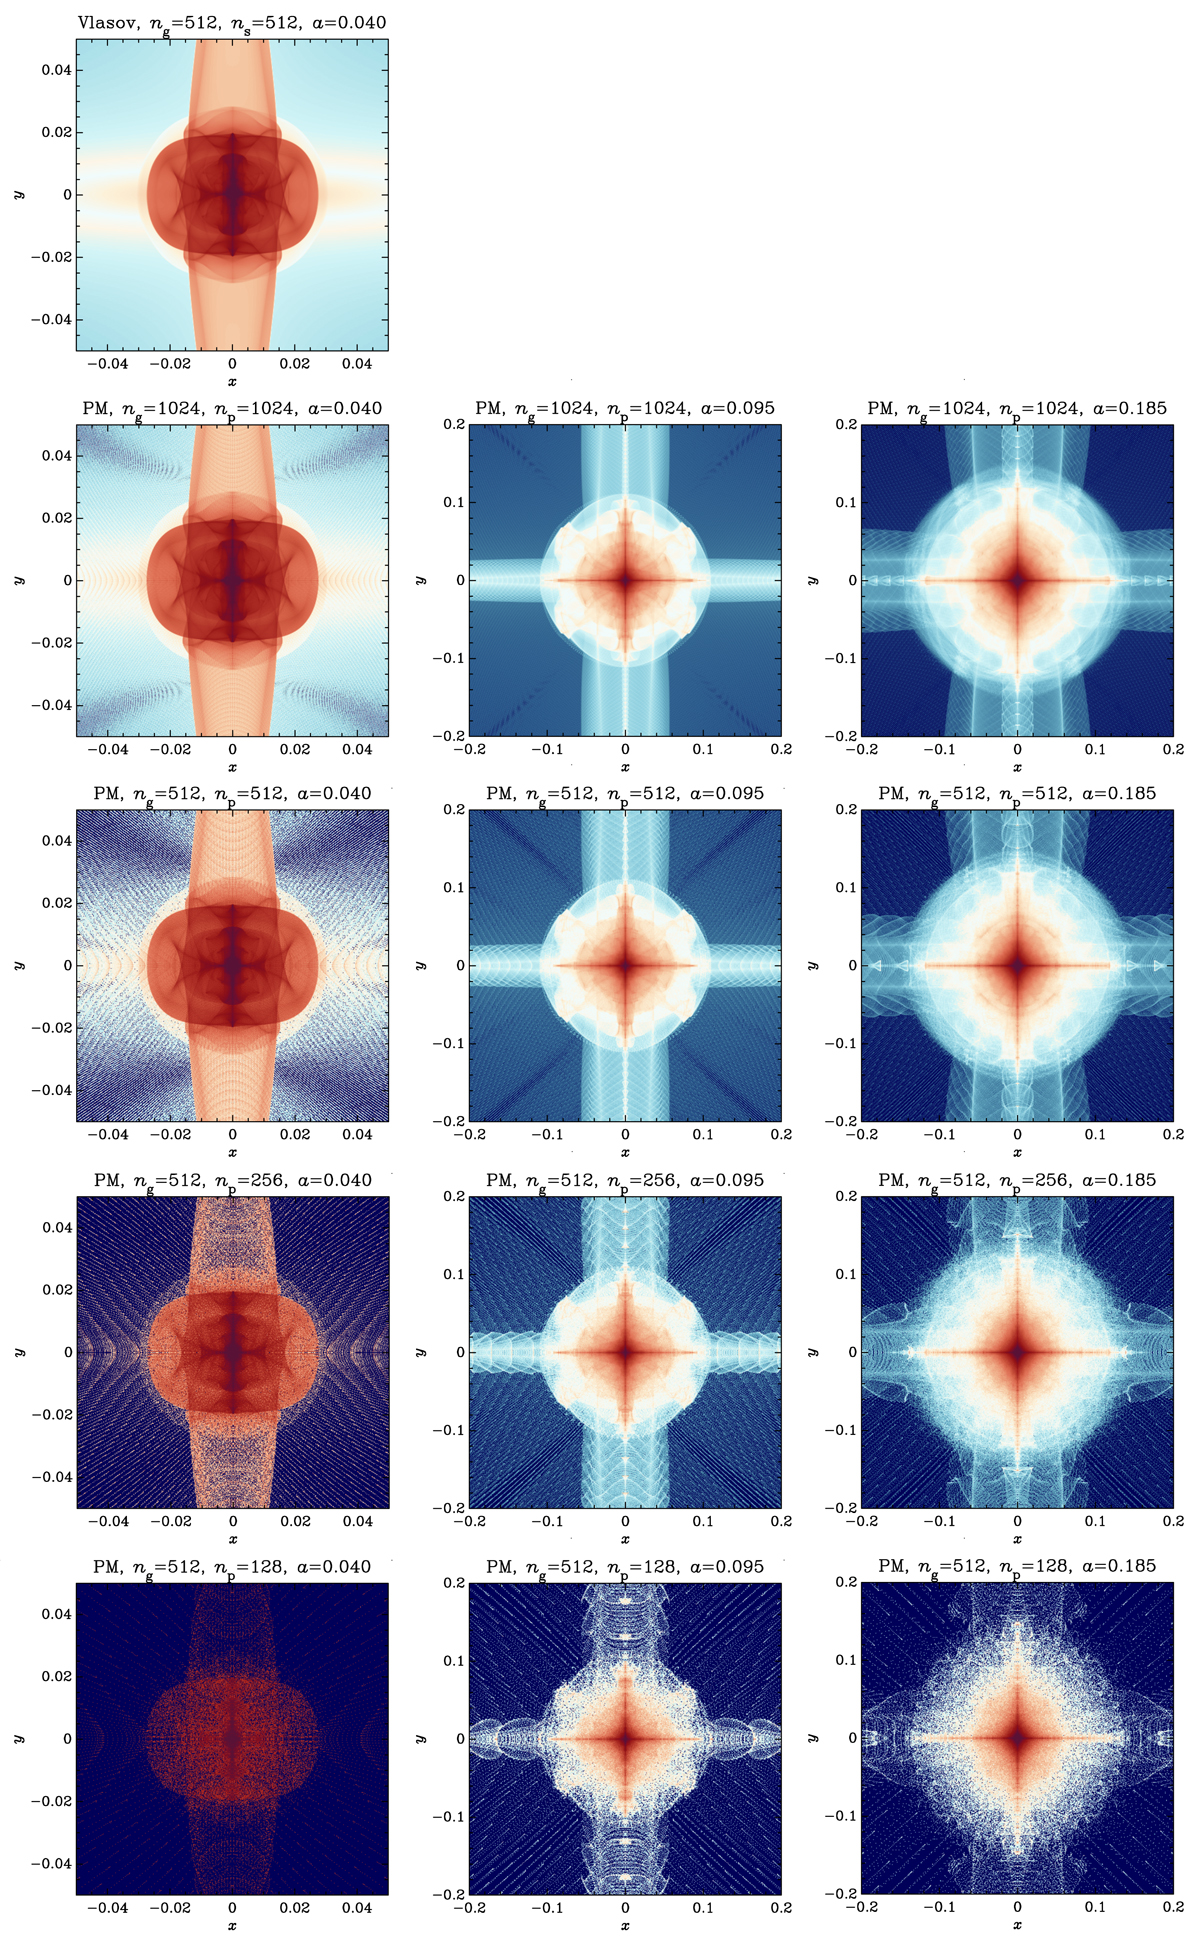
Effect of mass resolution in the PM runs: total projected density on (x, y) plane of the simulations of three crossed sine waves with ϵ = (3/4, 1/2). Except for the top panel which represents the last snapshot of the highest resolution Vlasov run, each row of panels corresponds, for various expansion factors, to a different number of particles, ![]() , with np = 1024, 512, 256, and 128 (from top to bottom). The spatial resolution is ng = 512 for all the simulations, except for the first row of panels, where it is ng = 1024. The images are computed from the projection on the (x, y) plane of the density calculated on a 5123 mesh spanning a cube of size Lsub = L/10 in the left panels and Lsub = L/2.5 otherwise, by using the nearest grid point interpolation. The logarithmic colour table goes from dark blue to white, then to dark red. The mass, hence the contribution of each particle, increases with dilution, which explains the change in colour towards dark red of the individual particles in underdense regions when np decreases. The simulations considered are designated (from top to bottom) as VLA-ANI2-FHR, PM-ANI2-UHR, PM-ANI2-HR, PM-ANI2-HR-D8, and PM-ANI2-HR-D64 in Table 1.
, with np = 1024, 512, 256, and 128 (from top to bottom). The spatial resolution is ng = 512 for all the simulations, except for the first row of panels, where it is ng = 1024. The images are computed from the projection on the (x, y) plane of the density calculated on a 5123 mesh spanning a cube of size Lsub = L/10 in the left panels and Lsub = L/2.5 otherwise, by using the nearest grid point interpolation. The logarithmic colour table goes from dark blue to white, then to dark red. The mass, hence the contribution of each particle, increases with dilution, which explains the change in colour towards dark red of the individual particles in underdense regions when np decreases. The simulations considered are designated (from top to bottom) as VLA-ANI2-FHR, PM-ANI2-UHR, PM-ANI2-HR, PM-ANI2-HR-D8, and PM-ANI2-HR-D64 in Table 1.
Current usage metrics show cumulative count of Article Views (full-text article views including HTML views, PDF and ePub downloads, according to the available data) and Abstracts Views on Vision4Press platform.
Data correspond to usage on the plateform after 2015. The current usage metrics is available 48-96 hours after online publication and is updated daily on week days.
Initial download of the metrics may take a while.