Fig. 19.
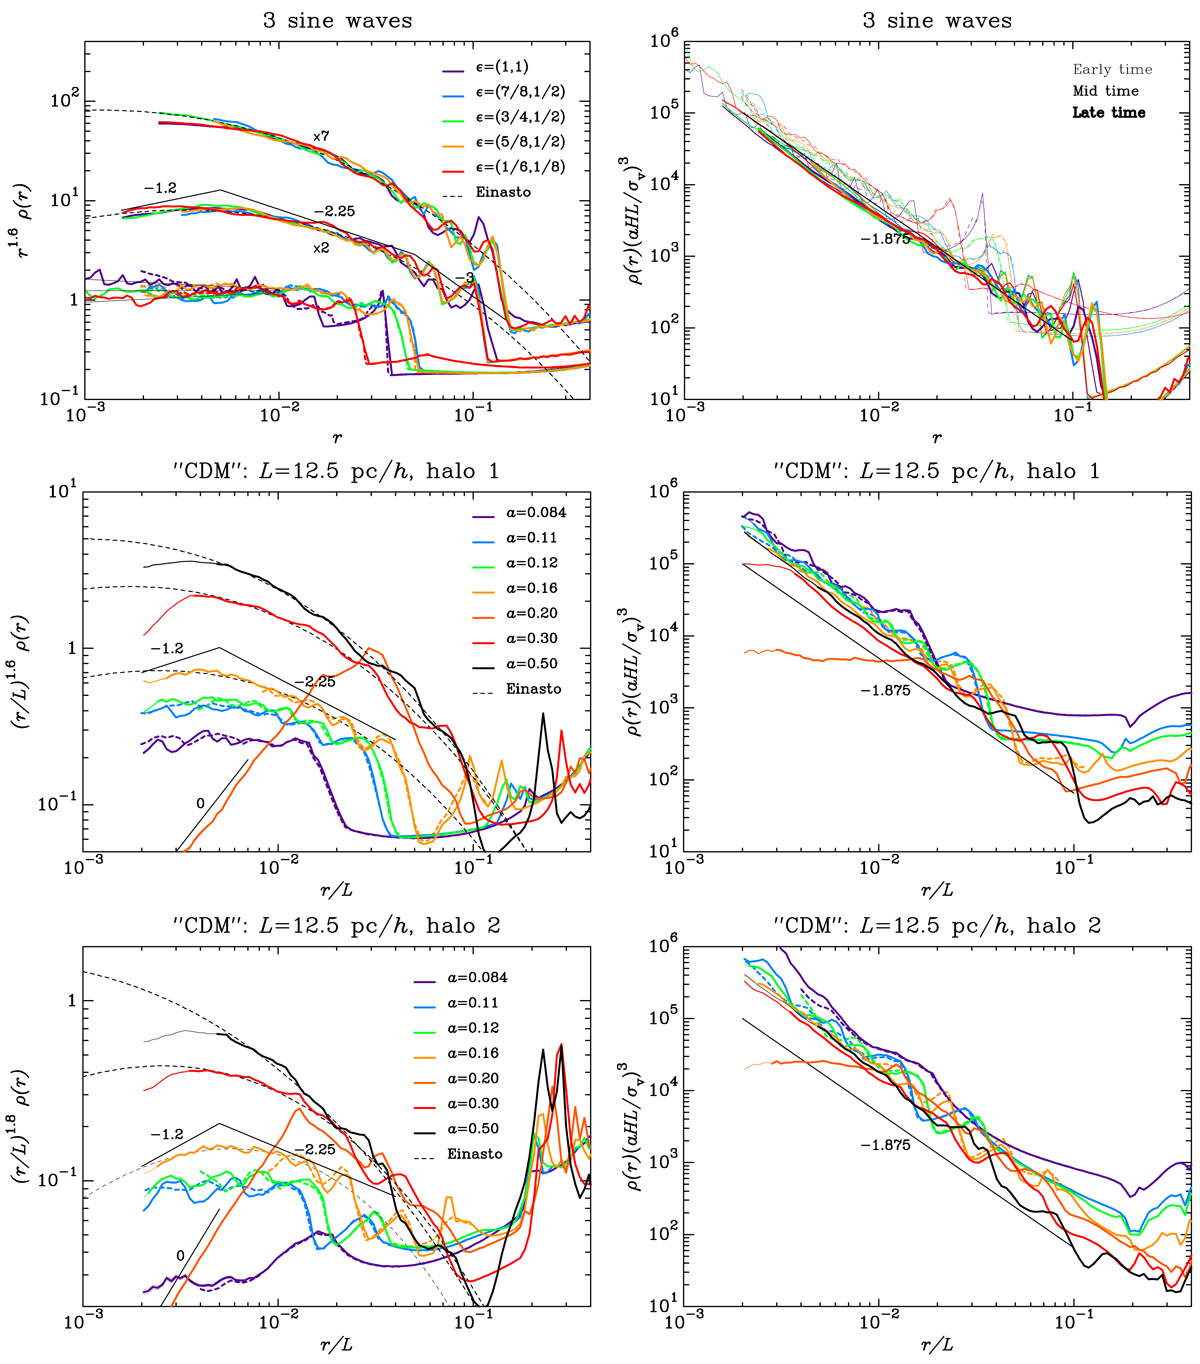
Time evolution of the radial density profile (left) and of the pseudo phase-space density (right). Top two panels: results obtained for the three-sine-wave simulations for different values of ϵ. Three regimes are considered: early time, mid time (multiplied by a factor 2 for clarity on left panel), and late time (multiplied by a factor 7 in the left panel), as detailed in Table 2. The continuous curves of various colours correspond to the highest resolution PM runs, namely PM-Q1D-UHR, PM-ANI1-HR, PM-ANI2-UHR, PM-ANI3-HR, and PM-SYM-UHR in Table 1. Only the parts of the curves that are not supposed to be influenced by force softening are shown. In addition, the dashed curves of the same colour provide the measurements obtained at early time in high resolution Vlasov simulations, namely VLA-Q1D-HR, VLA-ANI1-HRS, VLA-ANI2-HR, VLA-ANI3-HRS, and VLA-SYM-HR. To emphasise the very clear power-law behaviour present at early time, the quantity actually displayed in the left panel is rαρ(r), with α = 1.6. In addition, the thin lines indicate different slopes, in particular ρ(r) ∝ r−2.25 and Q(r) ∝ r−1.875, as predicted by the secondary spherical infall model; the dashed curves show Einasto profiles with parameters given in Table 4; finally, the three close very thin lines in the top left panel also indicate small variations in the logarithmic slope: α = 1.5, 1.6, and 1.7. Next two rows of panels: as in the two top rows, but respectively for halos 1 and 2 extracted from the ‘CDM’ runs with L = 12.5 pc h−1. Several values of the expansion factor are considered to show various stages of the evolution. Again, the continuous curves of various colours correspond to the PM run PM-CDM12.5-HR. They become thinner at small scales, where force softening is thought to influence the results. The dashed curves of the same colour correspond to Vlasov simulations of the highest possible resolution available, namely VLA-CDM12.5-HR for a = 0.084 and 0.11, VLA-CDM12.5-MR for a = 0.12, and VLA-CDM12.5-LR for a = 0.16. Mergers, which induce a temporary flattening of the density profile, are emphasised by thin lines with α = 0.
Current usage metrics show cumulative count of Article Views (full-text article views including HTML views, PDF and ePub downloads, according to the available data) and Abstracts Views on Vision4Press platform.
Data correspond to usage on the plateform after 2015. The current usage metrics is available 48-96 hours after online publication and is updated daily on week days.
Initial download of the metrics may take a while.