Fig. 18.
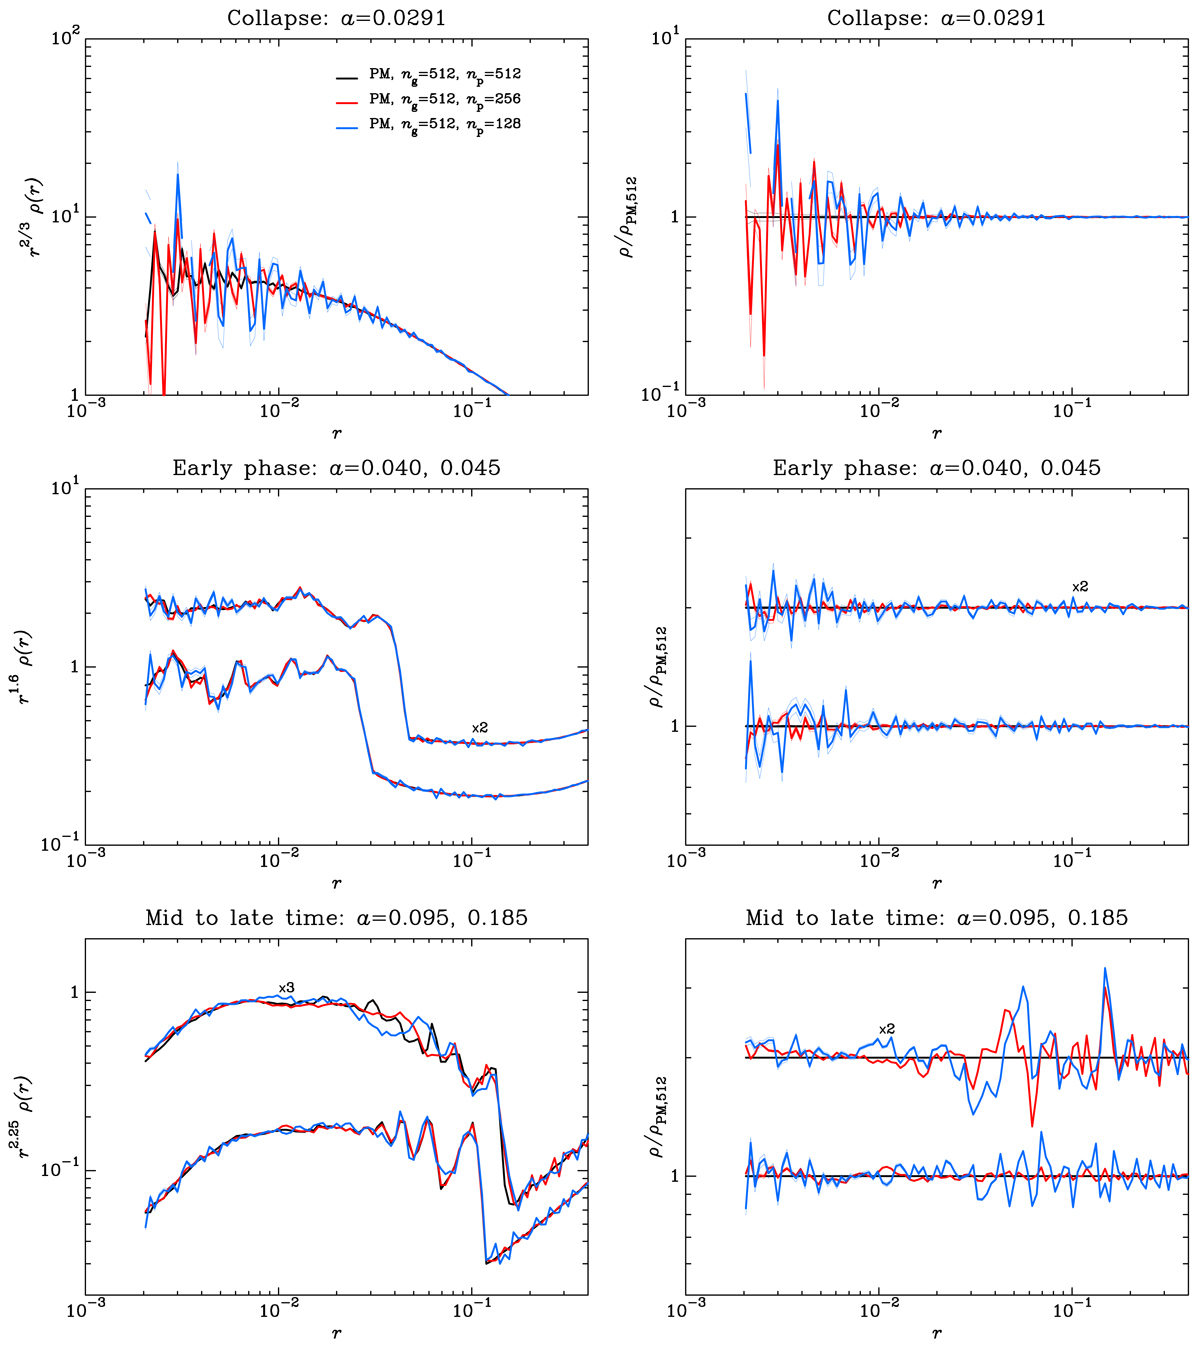
Radial density profile. Mass resolution analysis of the three-sine-wave PM simulations with ϵ = (3/4, 1/2). This figure is analogous to Fig. 17, except that it focuses on the effect of changing the number of particles ![]() in the N-body runs. All the simulations have the same spatial resolution, ng = 512, but different values of np, namely np = 512 (black, PM-ANI2-HR), 256 (red, PM-ANI2-MR), and 128 (blue, PM-ANI2-LR). In the right panels, the ratio considered is ρ/ρPM, 512, where ρPM, 512 is the density measured in the PM run with ng = np = 512 corresponding to the black curves.
in the N-body runs. All the simulations have the same spatial resolution, ng = 512, but different values of np, namely np = 512 (black, PM-ANI2-HR), 256 (red, PM-ANI2-MR), and 128 (blue, PM-ANI2-LR). In the right panels, the ratio considered is ρ/ρPM, 512, where ρPM, 512 is the density measured in the PM run with ng = np = 512 corresponding to the black curves.
Current usage metrics show cumulative count of Article Views (full-text article views including HTML views, PDF and ePub downloads, according to the available data) and Abstracts Views on Vision4Press platform.
Data correspond to usage on the plateform after 2015. The current usage metrics is available 48-96 hours after online publication and is updated daily on week days.
Initial download of the metrics may take a while.