Fig. 17.
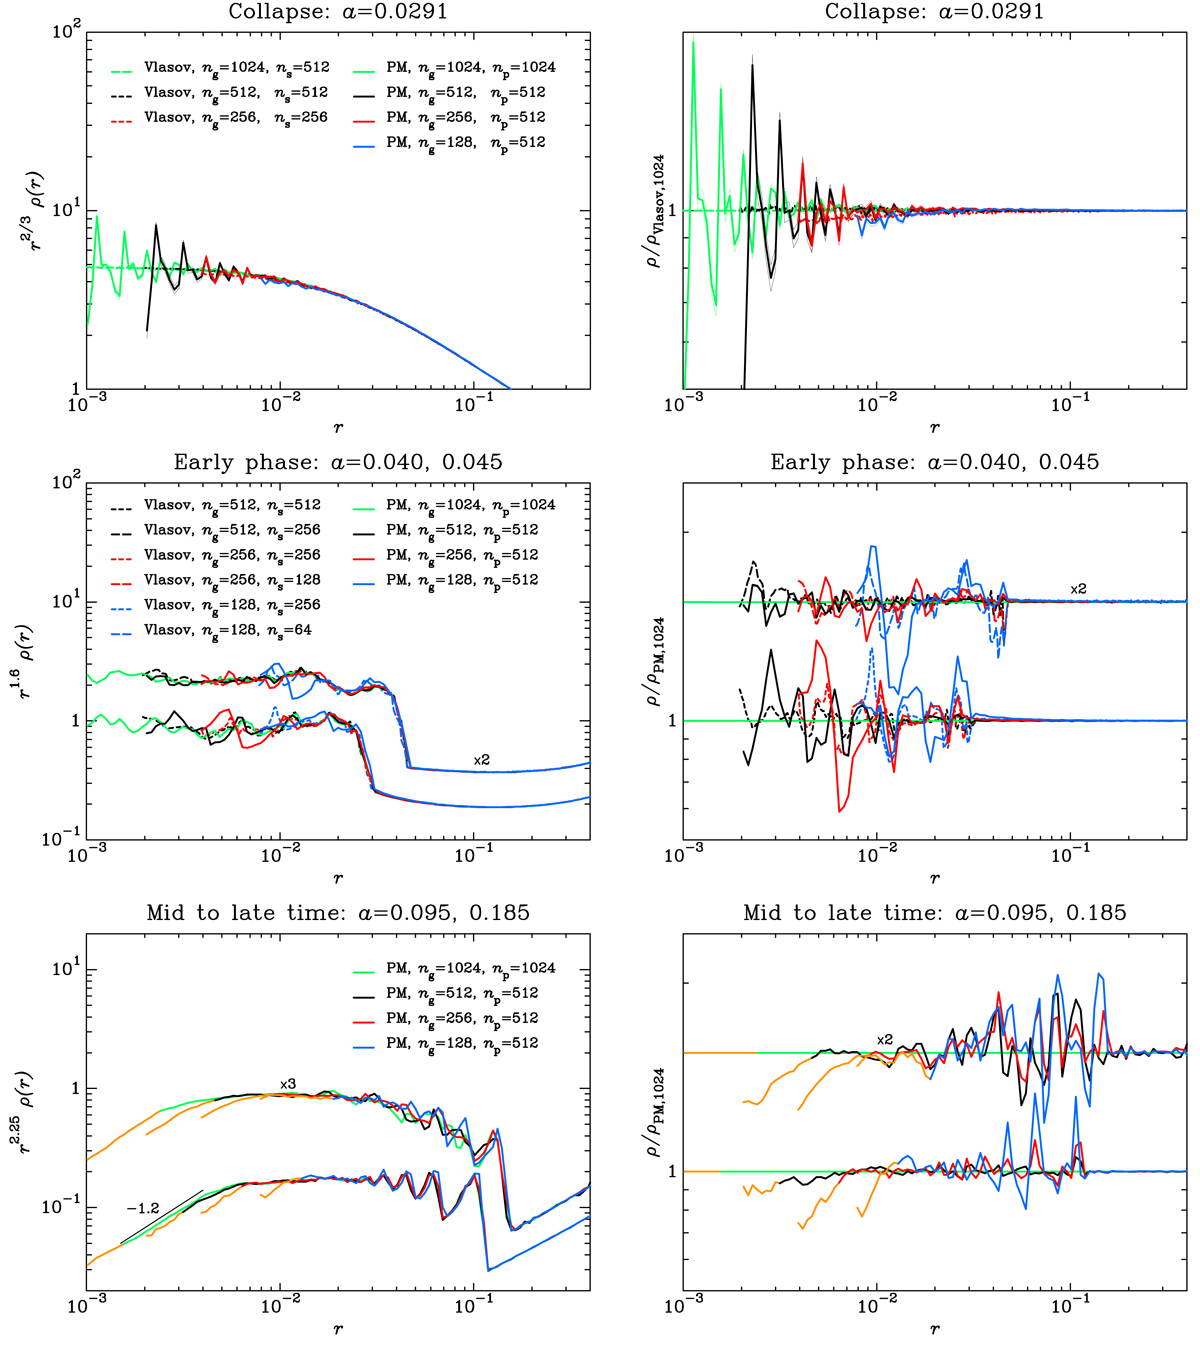
Radial density profile. Force resolution analysis of the three-sine-wave simulations with ϵ = (3/4, 1/2). Different epochs are considered following the conventions of Table 2, namely collapse time in the top panels, early time in the middle panels (for clarity, the curves corresponding to a = 0.045 are multiplied by a factor of 2) and mid to late time in the bottom panels (the curves corresponding to a = 0.185 are multiplied by a factor of 3 and 2 in the left and right panel, respectively). To have a better view of each regime, the quantity represented in the left column is the logarithm of rαρ(r), with α = 2/3, 1.6, and 2.25, respectively in the top, middle, and bottom panels (see text for details). Various simulations are considered, both in the Vlasov and PM cases, as indicated in each panel through the values of ng, ns, and np also shown in Table 1 (for the long-dashed black curve corresponding to a ColDICE run with ng = 512 and ns = 256, the simulation used is VLA-ANI2-HRS, but VLA-ANI2-HR would provide nearly identical results). In the bottom panels, the left part of the curves corresponding to the regions supposedly influenced by small-scale force softening is displayed in orange (see main text). To highlight better the differences between the various curves, the right column displays density ratios: in the top panel, the quantity displayed is ρ/ρVlasov, 1024, where ρVlasov, 1024 is the density measured in our highest resolution ColDICE run (corresponding to the dashed green curve); in the two bottom panels, the quantity displayed is ρ/ρPM, 1024, where ρPM, 1024 is the density measured in our highest resolution PM run (corresponding to the solid green curves).
Current usage metrics show cumulative count of Article Views (full-text article views including HTML views, PDF and ePub downloads, according to the available data) and Abstracts Views on Vision4Press platform.
Data correspond to usage on the plateform after 2015. The current usage metrics is available 48-96 hours after online publication and is updated daily on week days.
Initial download of the metrics may take a while.