Fig. 15.
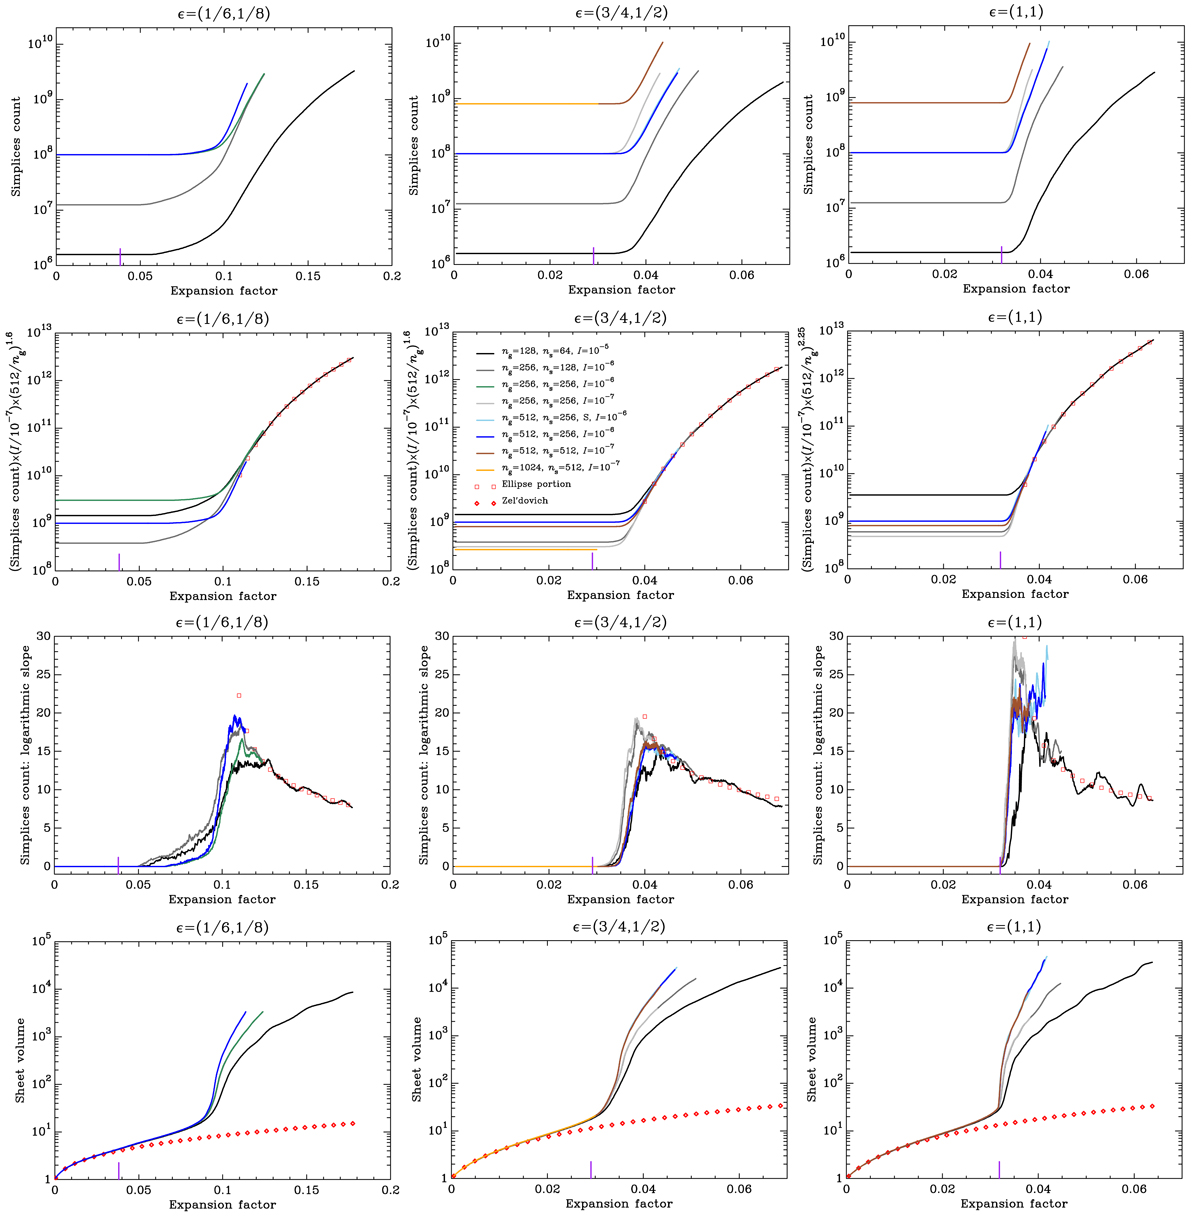
Complexity of the phase-space sheet. Simplex count and sheet volume in the simulations starting with the three crossed sine waves. Details of all the curves represented in each panel are provided in the middle panel of the second row. From left to right: different values of the initial relative amplitudes of the waves are considered, ϵ = (1/6, 1/8), (3/4, 1/2), and (1, 1), with collapse time indicated by the vertical purple segment. Top row of panels: simplex counts as functions of expansion factor for all the Vlasov runs listed in Table 1 except VLA-ANI2-LRa. Second row: simplex counts are rescaled by the factor (I/10−7)×(512/ng)α, with α = 1.6 in the two left panels and α = 2.25 in the right panel, as discussed in the main text. A fit with an ellipse portion in linear-logarithm space is also shown with red symbols (Eq. (19)). Third row: logarithmic slope of the simplex count, to be compared again to the red squares, which correspond to the logarithmic slope derived from the ellipse portion. Last row: phase-space sheet volume as a function of expansion factor. All the curves should superpose on each other; the differences relate to spatial resolution ng. The red losanges provide the prediction from the Zel’dovich approximation.
Current usage metrics show cumulative count of Article Views (full-text article views including HTML views, PDF and ePub downloads, according to the available data) and Abstracts Views on Vision4Press platform.
Data correspond to usage on the plateform after 2015. The current usage metrics is available 48-96 hours after online publication and is updated daily on week days.
Initial download of the metrics may take a while.