Fig. 14.
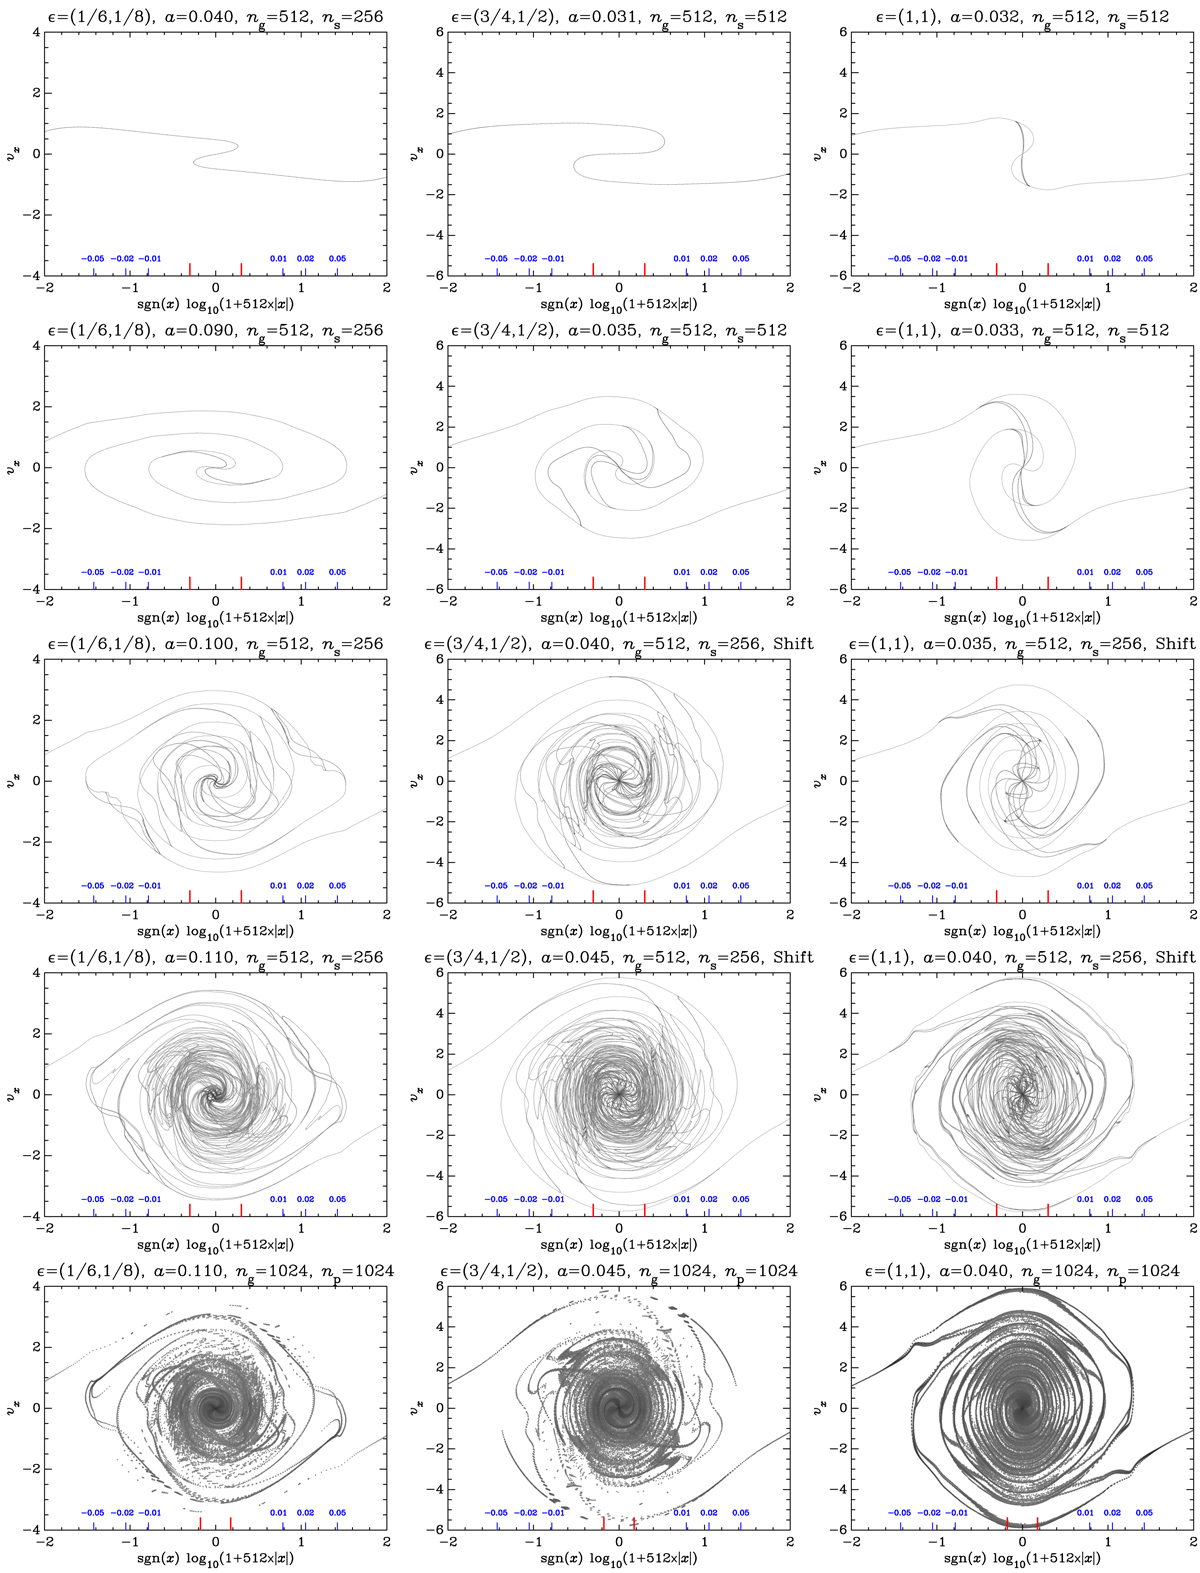
Phase-space slice. Early time evolution of three-sine-wave simulations with various amplitudes. Except for the last row of panels which is dedicated to PM simulations, the Vlasov runs with ϵ = (1/6, 1/8), (3/4, 1/2), and (1, 1) are considered in the left, middle, and right columns, respectively, with time augmenting from top to bottom, starting shortly after the first shell crossing. In the two top rows of panels, the highest resolution Vlasov runs with ng = ns = 512 are under scrutiny, when available, namely VLA-ANI2-FHR and VLA-SYM-FHR in the middle and right columns, otherwise, VLA-Q1D-HR, VLA-ANI2-HRS, and VLA-SYM-HRS are considered, respectively for the left, middle, and right column, with Ng = 512 and ns = 256. To complete the figure, the last row of panels shows, at the same time as the fourth row, the results obtained from our highest resolution PM runs, with ng = np = 1024, namely (from left to right), PM-Q1D-UHR, PM-ANI2-UHR, and PM-SYM-UHR. In this case is considered, as in Figs. 10–12, a very thin slice of particles with (y, z) ∈ [−5 × 10⁻⁴, 5 × 10⁻⁴] as tracers of the phase-space sheet.
Current usage metrics show cumulative count of Article Views (full-text article views including HTML views, PDF and ePub downloads, according to the available data) and Abstracts Views on Vision4Press platform.
Data correspond to usage on the plateform after 2015. The current usage metrics is available 48-96 hours after online publication and is updated daily on week days.
Initial download of the metrics may take a while.