Fig. 10.
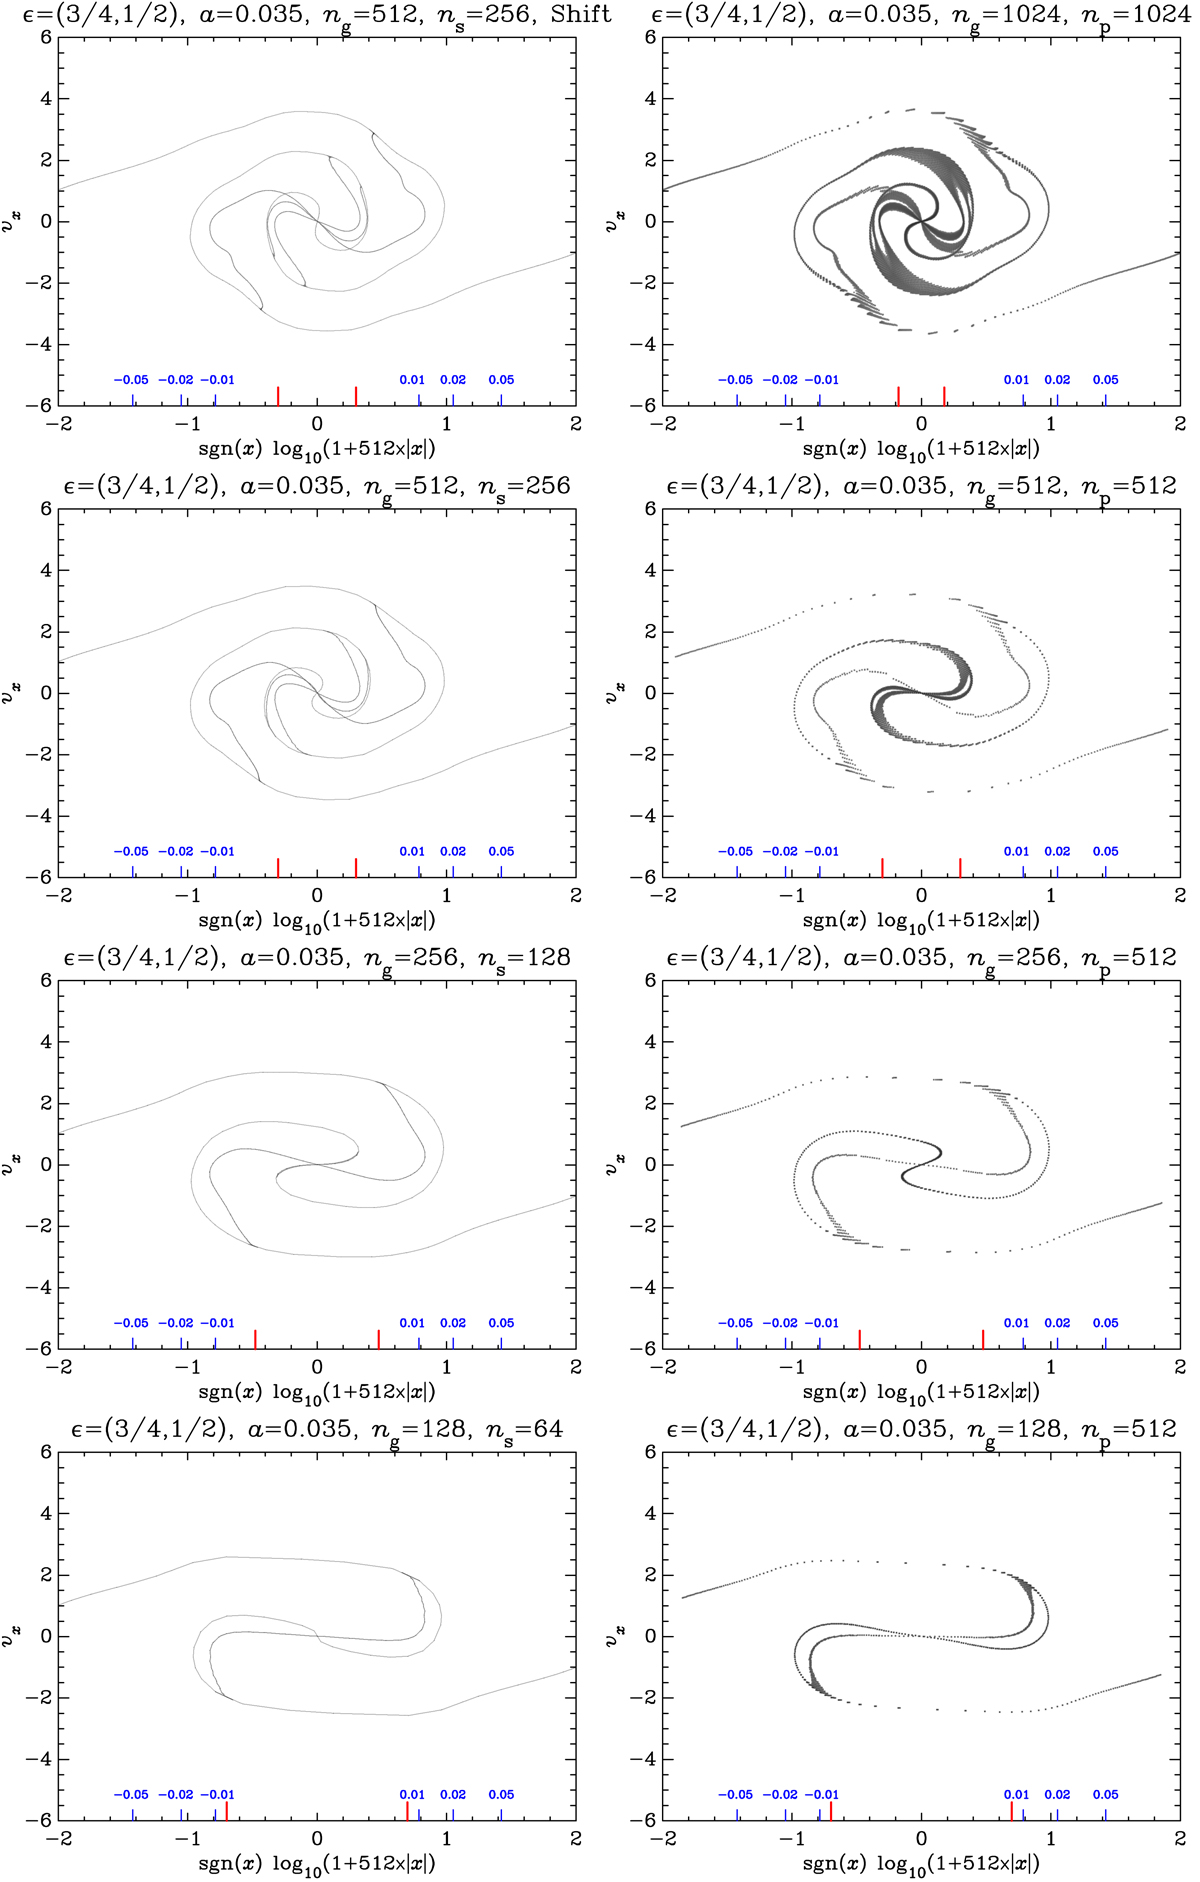
Phase-space slice. Force resolution analysis and comparison between Vlasov and PM for the three-sine-wave simulations with ϵ = (3/4, 1/2) and a = 0.035. To have a better view of the fine structures of the system, the x coordinate is represented in logarithmic scale, sgn(x)log10(1 + 512 × |x|). Some values of x are indicated in blue inside each panel, while the two red vertical segments indicate the force resolution scale, L/ng, which increases from top to bottom. The Vlasov runs are considered in the left panels. In this case, the intersection of the phase-space sheet with the hyperplane y = z = 0 is calculated directly at linear order and represented in (x, vx) coordinates. The two top left panels consider Vlasov runs with ng = 512 and ns = 256. The only difference between the two simulations is the initial shift of half a voxel size imprinted in initial conditions of the simulation considered in the top left panel (VLA-ANI2-HRS in Table 1) compared to the simulation in panel just below (VLA-ANI2-HR). Our highest resolution run, VLA-ANI2-FHR (with ns = 512 instead of 256), gives nearly identical results to VLA-ANI2-HR, and is not shown here. The two bottom left panels consider lower force resolution Vlasov runs with ng = 256 (VLA-ANI2-MR) and then ng = 128 (VLA-ANI2-LR). The PM runs are examined in the right panels. In this case a very thin slice of particles is considered with (y, z) ∈ [−5 × 10⁻⁴, 5 × 10⁻⁴] as tracers of the phase-space sheet. The top right panel shows the results obtained from our highest resolution PM run, PM-ANI2-UHR, with ng = 1024 and np = 1024. The three next panels all have the same number of particles, ![]() , but decreasing spatial resolution, ng = 512, 256, and 128 for PM-ANI2-HR, PM-ANI2-MR, and PM-ANI2-LR, respectively.
, but decreasing spatial resolution, ng = 512, 256, and 128 for PM-ANI2-HR, PM-ANI2-MR, and PM-ANI2-LR, respectively.
Current usage metrics show cumulative count of Article Views (full-text article views including HTML views, PDF and ePub downloads, according to the available data) and Abstracts Views on Vision4Press platform.
Data correspond to usage on the plateform after 2015. The current usage metrics is available 48-96 hours after online publication and is updated daily on week days.
Initial download of the metrics may take a while.