Fig. 1.
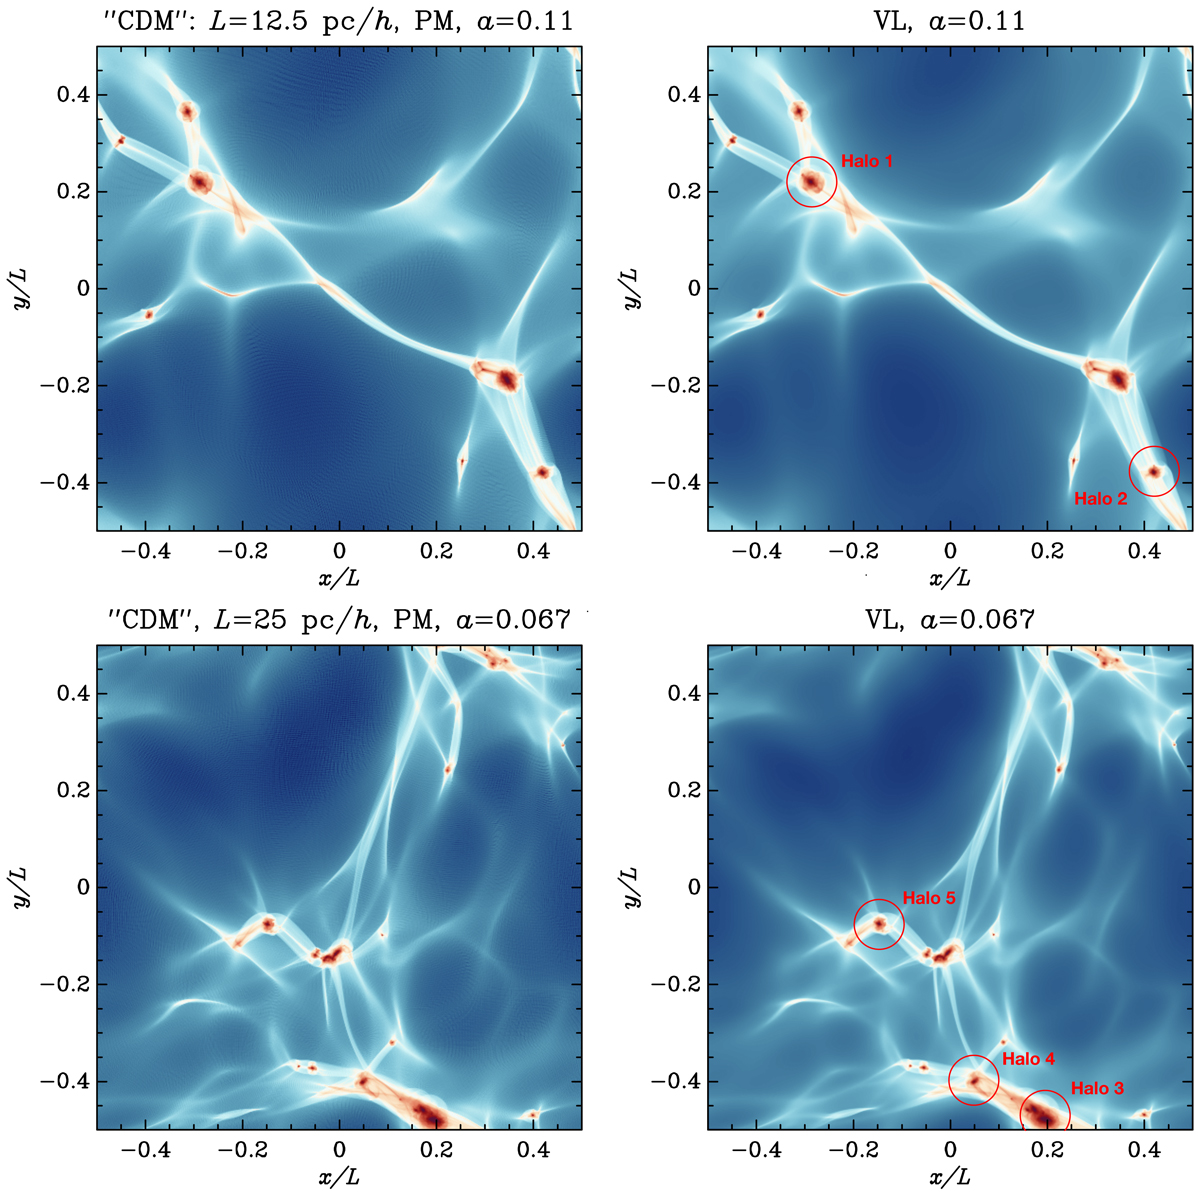
Total projected density on (x, y) plane of the ‘CDM’ simulations: comparison of ColDICE to PM. The logarithmic colour table changes from dark blue to white and then to dark red when the density increases. Left and right panels: PM and ColDICE simulations, respectively, and top and bottom: box size L = 12.5 and 25 pc h−1, respectively. The simulations considered here are designated by PM-CDM12.5-HR (top left), PM-CDM25-HR (bottom left), VLA-CDM12.5-HR (top right), and VLA-CDM25-HR (bottom right) in Table 1. The expansion factor indicated in each panel corresponds to the last snapshot of the Vlasov runs. Additionally, in the right panels, circles indicate the halos selected for detailed analyses.
Current usage metrics show cumulative count of Article Views (full-text article views including HTML views, PDF and ePub downloads, according to the available data) and Abstracts Views on Vision4Press platform.
Data correspond to usage on the plateform after 2015. The current usage metrics is available 48-96 hours after online publication and is updated daily on week days.
Initial download of the metrics may take a while.