Free Access
Fig. A.2.
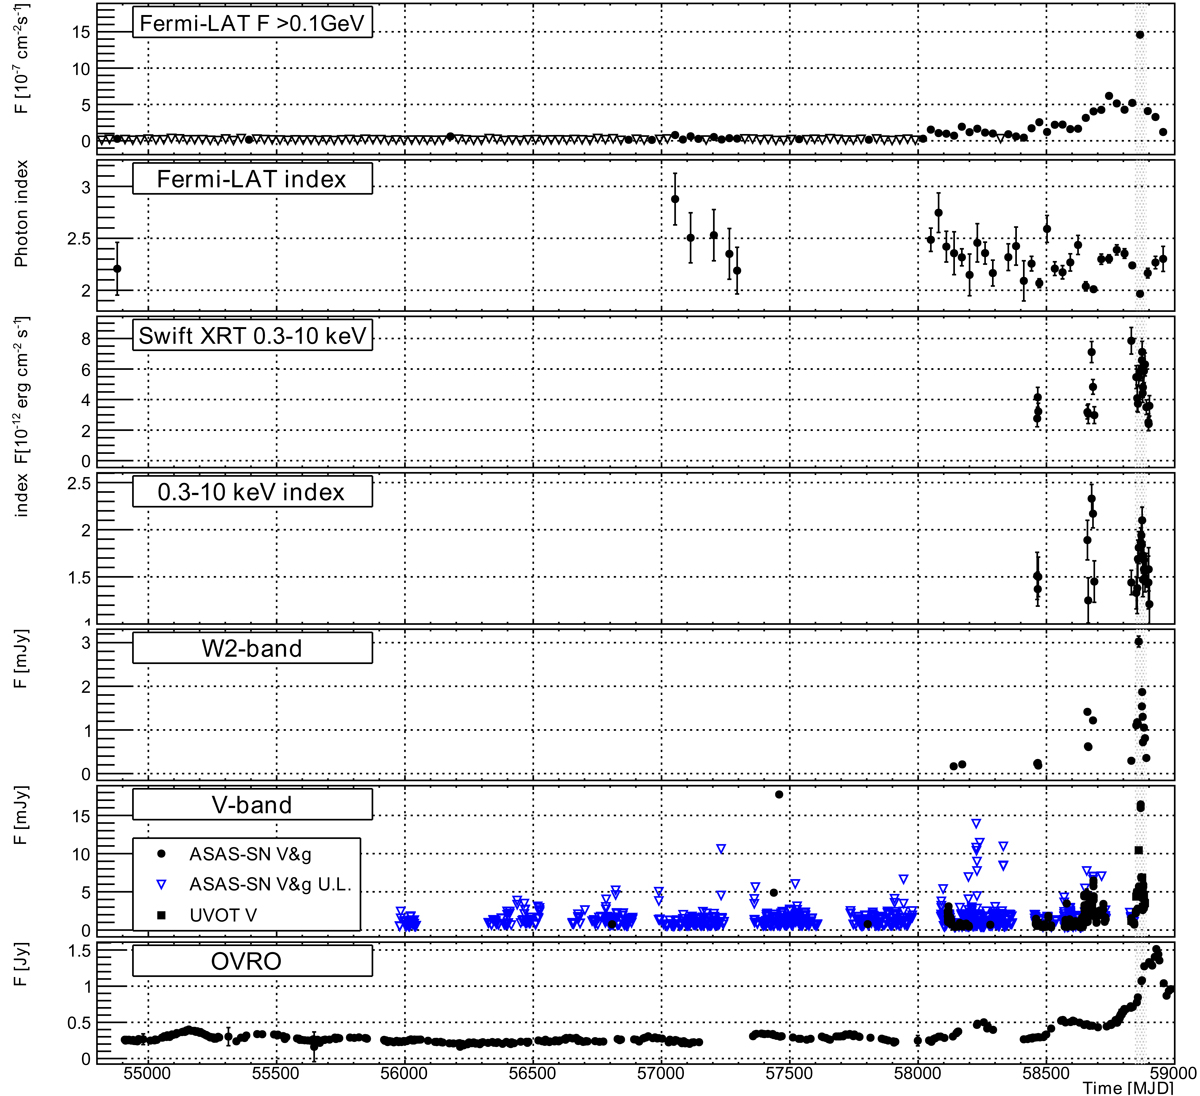
Long-term MWL light curve of QSO B1420+326 (see titles and legends of individual panels). The gray-shaded region shows the flaring period in the beginning of 2020.
Current usage metrics show cumulative count of Article Views (full-text article views including HTML views, PDF and ePub downloads, according to the available data) and Abstracts Views on Vision4Press platform.
Data correspond to usage on the plateform after 2015. The current usage metrics is available 48-96 hours after online publication and is updated daily on week days.
Initial download of the metrics may take a while.