Fig. 6
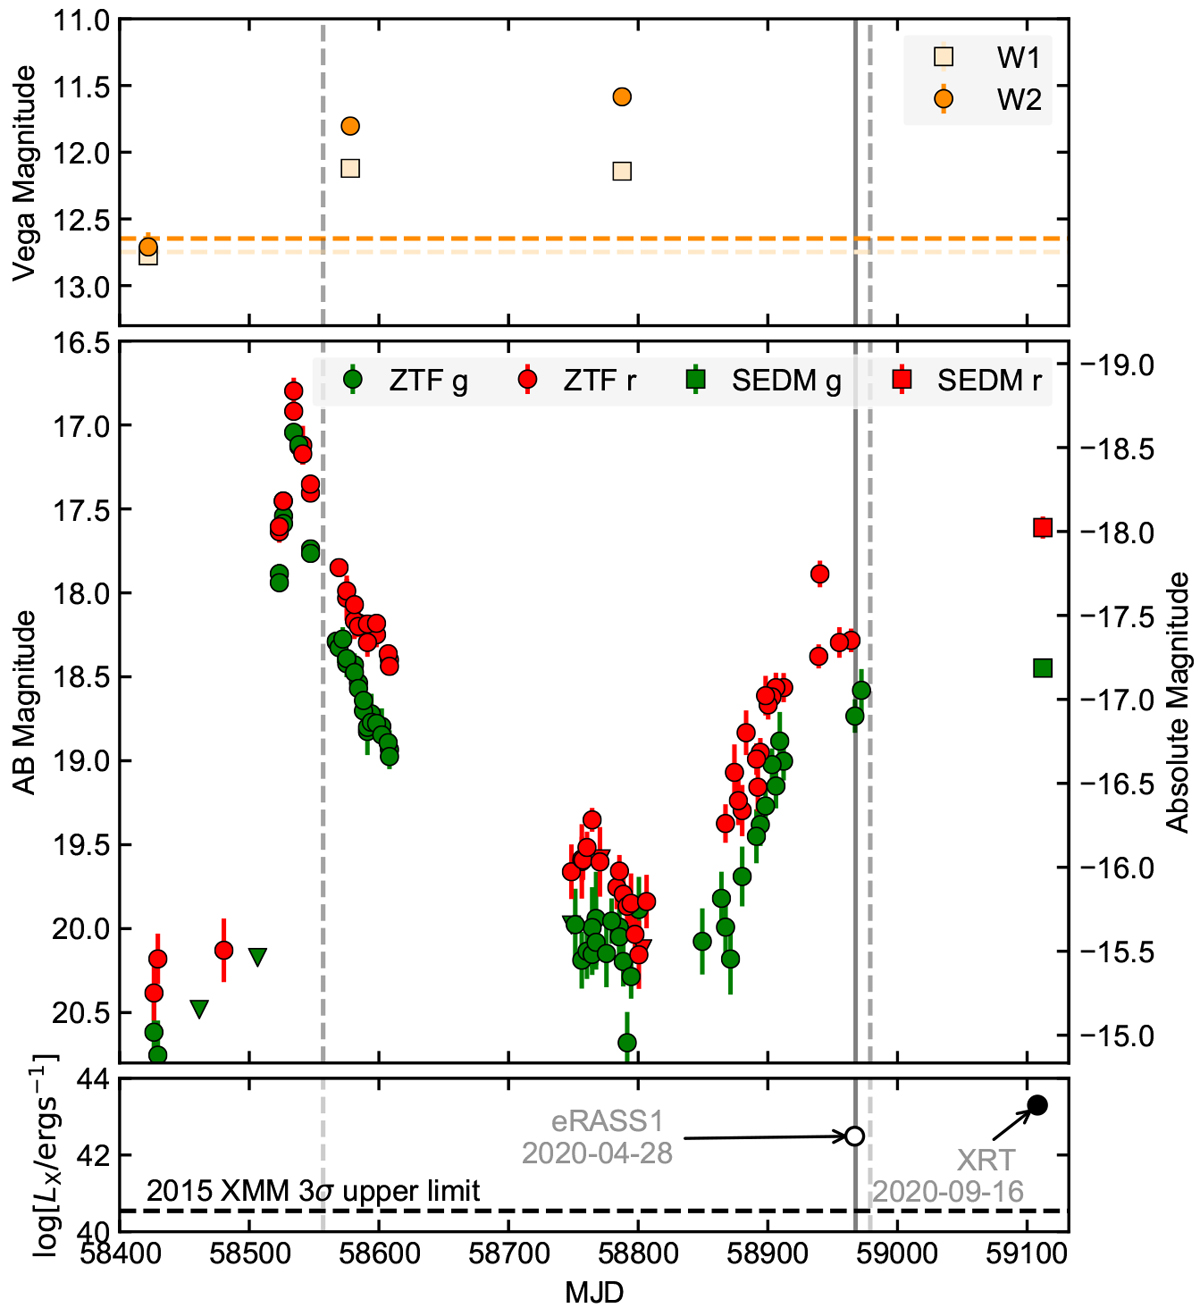
NEOWISE-R (non-host subtracted, top) and ZTF/ SEDM (middle) light curves of AT 2019avd, with the immediate 0.2−2 keV X-ray history shown in the bottom panel. The eROSITA eRASS1 detection and the Swift observation from 2020-09-16 are the empty and filled black markers, respectively. The solid grey vertical line marks the MJD of the eRASS1 observation, whilst grey dashed lines mark the times of the NOT and the first FLOYDS spectrum (Table 5). No significant variability before the initial 2019 outburst is observed in the host nucleus of AT 2019avd with archival NEOWISE-R and ASAS-SN observations (Fig. B.1). The NEOWISE-R observations pre-outburst are observed with mean W1, W2 marked out in the top panel by the cream and orange dashed lines respectively. For plotting clarity, we omit the high-cadence ZTF Partnership observations obtained between MJD 58 820 and 58 860, and we rebin the ~ 3 SEDM observations in each filter into a single data point.
Current usage metrics show cumulative count of Article Views (full-text article views including HTML views, PDF and ePub downloads, according to the available data) and Abstracts Views on Vision4Press platform.
Data correspond to usage on the plateform after 2015. The current usage metrics is available 48-96 hours after online publication and is updated daily on week days.
Initial download of the metrics may take a while.