Fig. 2
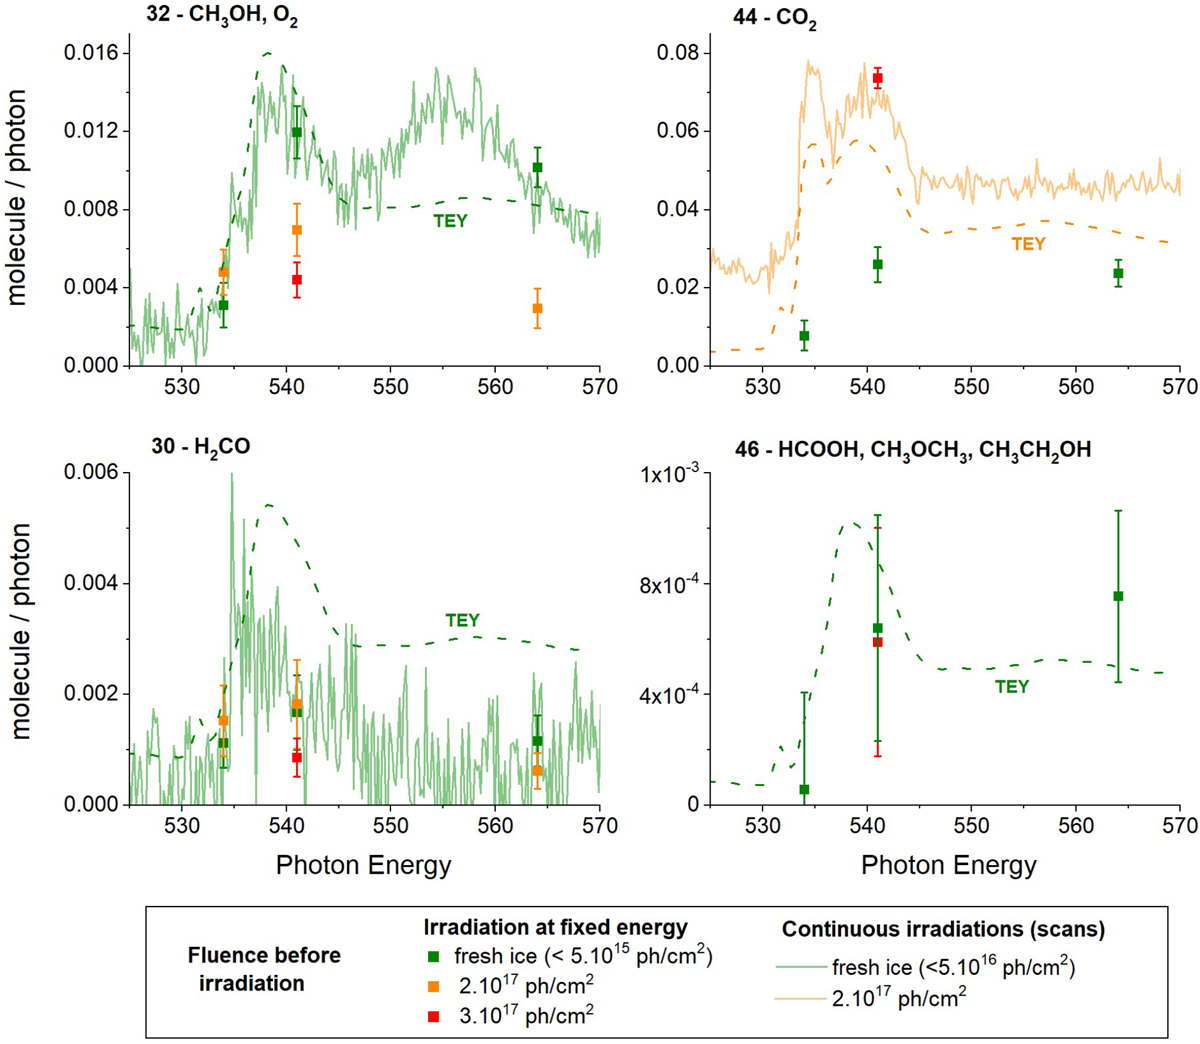
Photodesorption spectra for masses 30, 32, 44, and 46 in molecule/photon from pure methanol ice at 15 K, with the associated molecules. The measurements at fixed energy are represented by the squares with error bars. The scan experimentsare represented by solid lines. The TEYs measured during the scan experiments are also shown as dashed lines in arbitrary units. Information about the fluence received by the ice before each measurement is displayed in the bottom panel.
Current usage metrics show cumulative count of Article Views (full-text article views including HTML views, PDF and ePub downloads, according to the available data) and Abstracts Views on Vision4Press platform.
Data correspond to usage on the plateform after 2015. The current usage metrics is available 48-96 hours after online publication and is updated daily on week days.
Initial download of the metrics may take a while.