Fig. 9.
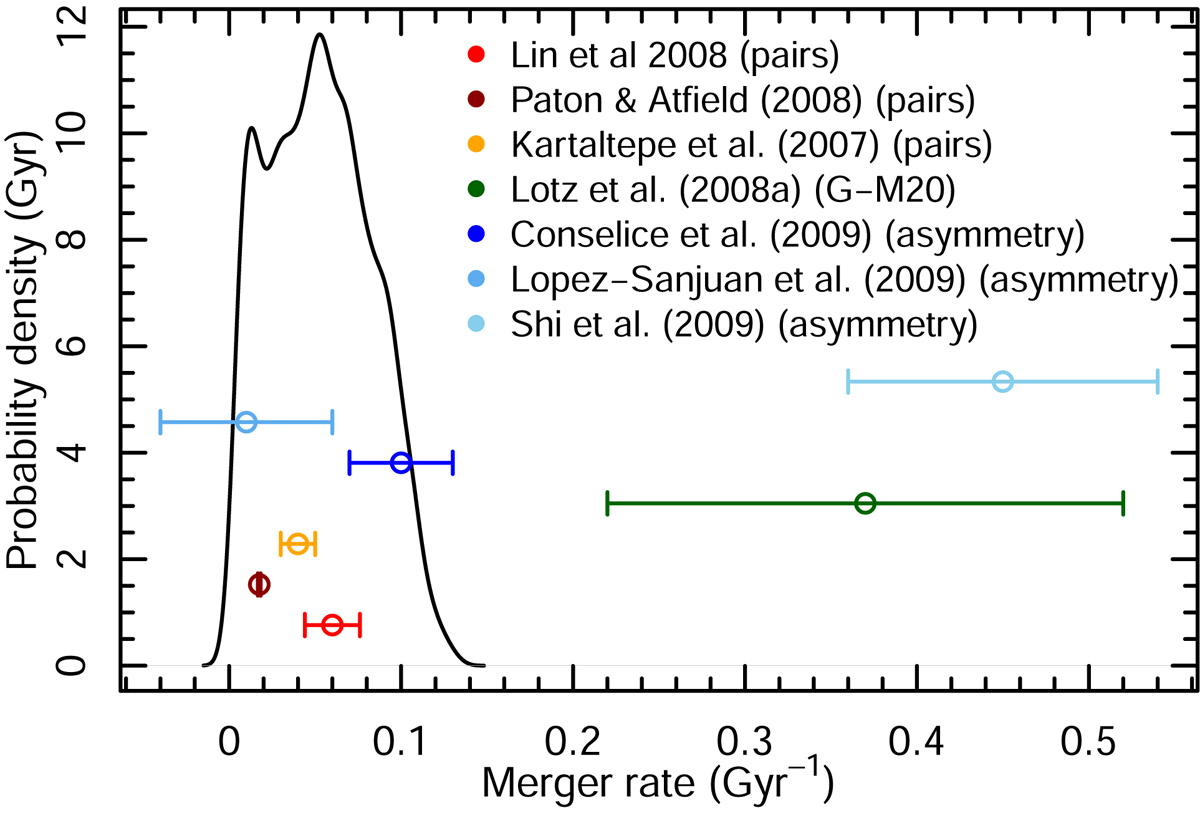
Posterior distribution of the major merger rate (black line), modelled for group galaxies and corrected to correspond to the whole galaxy sample (we note that Fig. 10 shows merger rate (ω) without this correction). Each point with an error bar shows a literature measurement (vertical positioning is arbitrary). Our value for ω = 0.11 ± 0.06 Gyr−1.
Current usage metrics show cumulative count of Article Views (full-text article views including HTML views, PDF and ePub downloads, according to the available data) and Abstracts Views on Vision4Press platform.
Data correspond to usage on the plateform after 2015. The current usage metrics is available 48-96 hours after online publication and is updated daily on week days.
Initial download of the metrics may take a while.