Fig. 8.
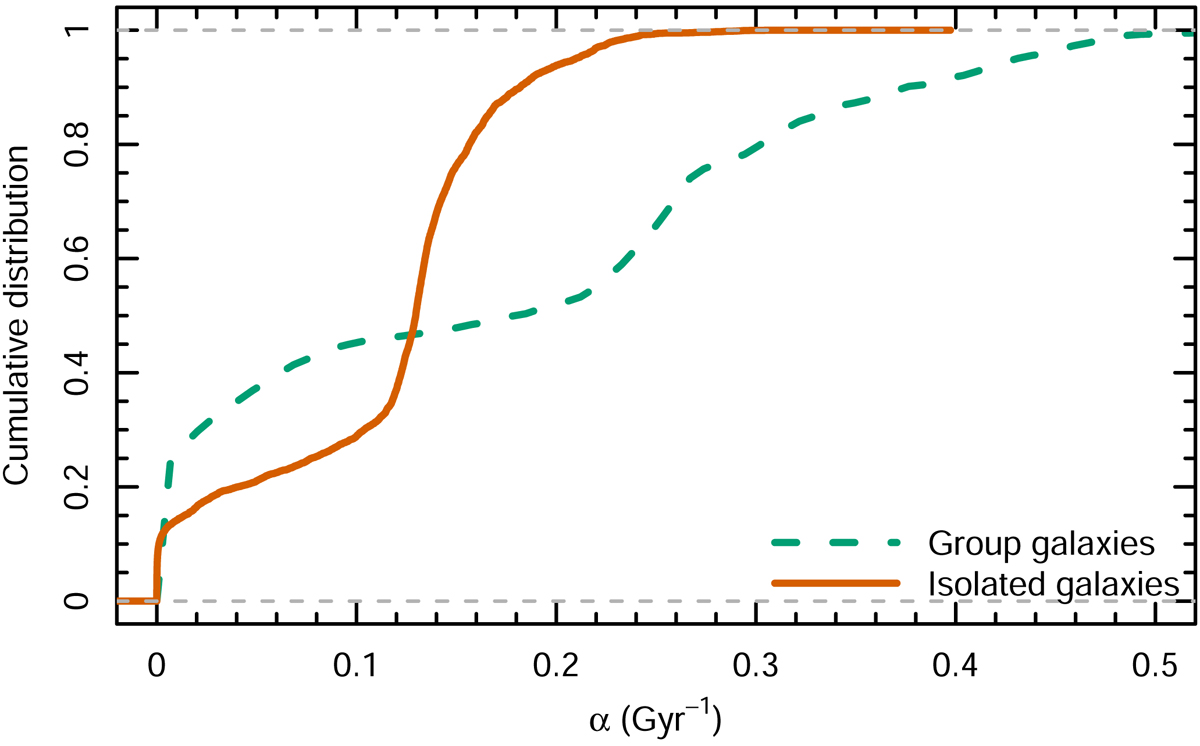
Cumulative posterior distribution of the α parameter, which describes the accretion of stars into a galaxies. The stars being accreted can be from the intergalactic medium, via minor mergers, or from globular clusters. The dashed green line shows the fitting results for group galaxies, while the orange line shows isolated galaxies. On average, the group galaxies accrete more stars compared to isolated ones.
Current usage metrics show cumulative count of Article Views (full-text article views including HTML views, PDF and ePub downloads, according to the available data) and Abstracts Views on Vision4Press platform.
Data correspond to usage on the plateform after 2015. The current usage metrics is available 48-96 hours after online publication and is updated daily on week days.
Initial download of the metrics may take a while.