Fig. 7.
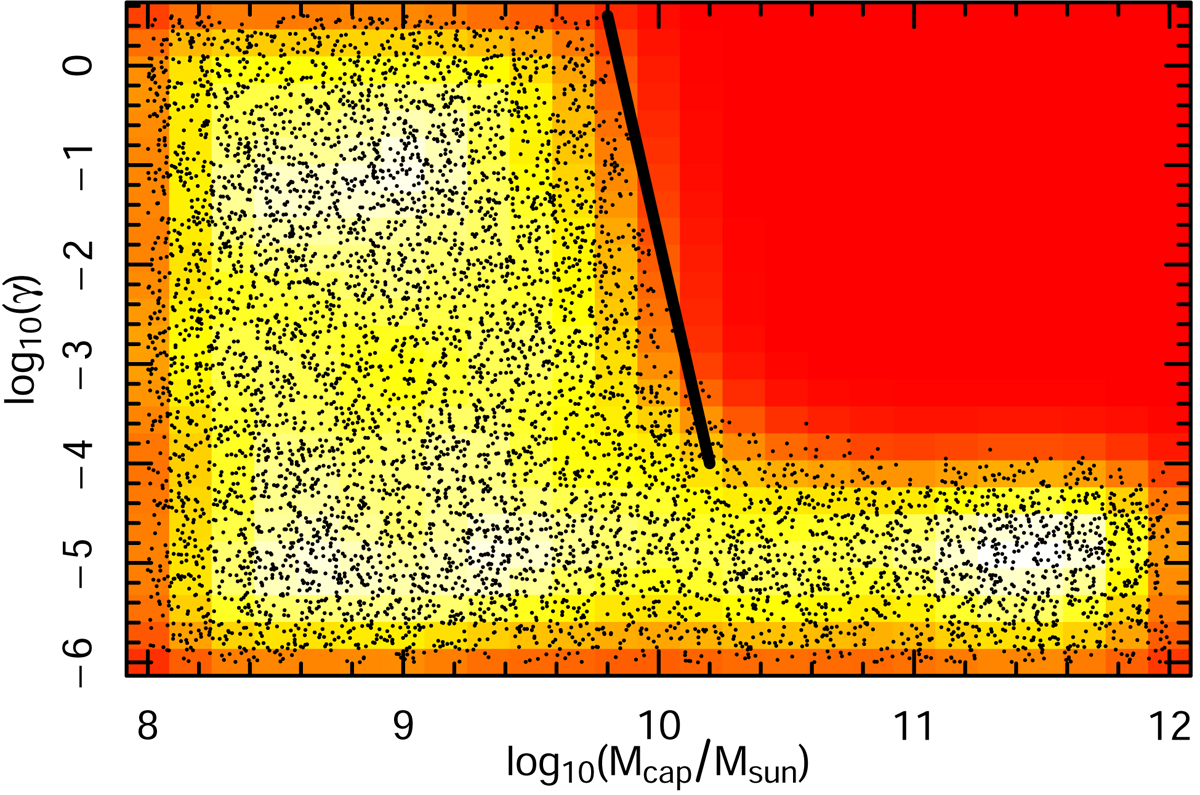
The mass quenching determination dependence on the gas accretion. The x-axis represents the mass of a galaxy at which it starts quenching, plotted against γ, which depicts the rate of gas accretion by the galaxy. Each dot represents a possible solution as posterior samples from the Multinest fitting. The colour background shows smoothed distribution of the posterior points. The solid black line given by (log10γ = 110.75−11.25log10(Mcap/M⊙)), shows that a galaxy that accretes gas in high quantities quenches at a lower mass compared to a galaxy that does not accrete a lot of gas.
Current usage metrics show cumulative count of Article Views (full-text article views including HTML views, PDF and ePub downloads, according to the available data) and Abstracts Views on Vision4Press platform.
Data correspond to usage on the plateform after 2015. The current usage metrics is available 48-96 hours after online publication and is updated daily on week days.
Initial download of the metrics may take a while.