Fig. 6.
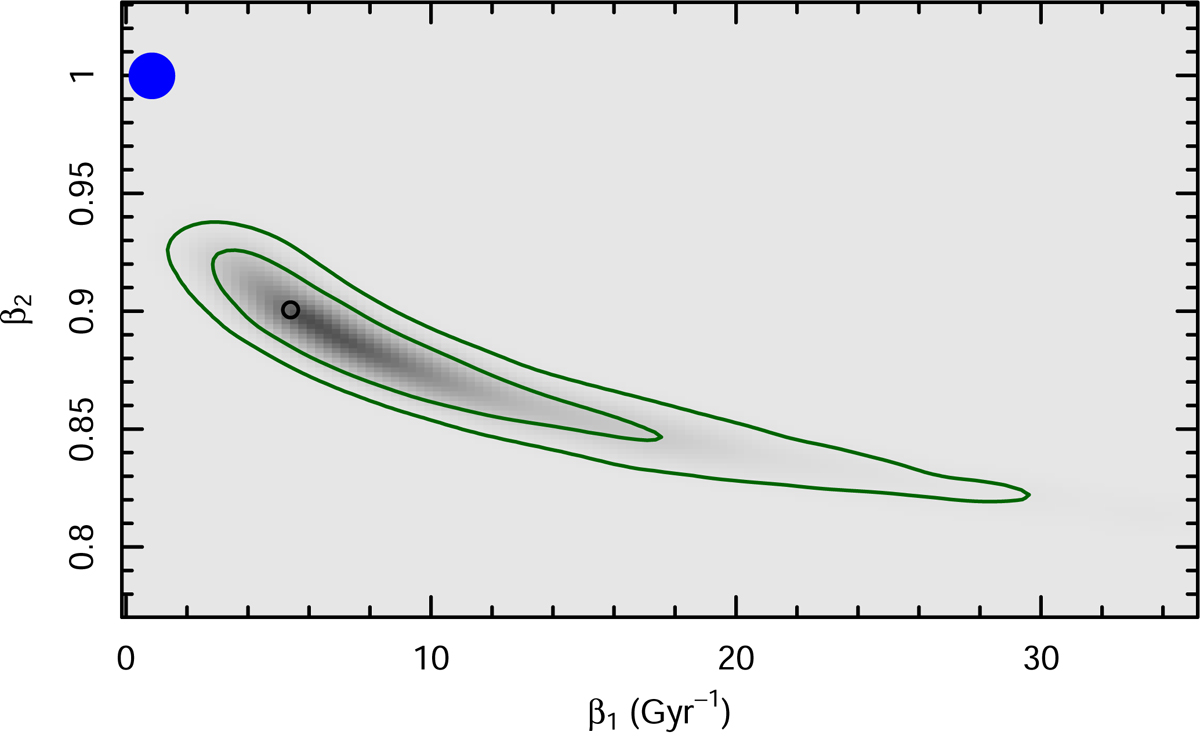
Decay of star formation described by the equation ![]() (see Eq. (3)) and its posterior distribution. The parameter β1 depicts the speed at which galaxies quench; a higher value indicates faster quenching and β2 describes the quenching behaviour and is related to the Kennicutt–Schmidt relation (see Appendix A). The green lines cover 65% and 95% of the total distribution. The large blue dot shows the modelling results for the case where β2 = 1. The secular evolution values need to be fixed for studying environmental effects. For the fixing we used the values depicted with the black dot.
(see Eq. (3)) and its posterior distribution. The parameter β1 depicts the speed at which galaxies quench; a higher value indicates faster quenching and β2 describes the quenching behaviour and is related to the Kennicutt–Schmidt relation (see Appendix A). The green lines cover 65% and 95% of the total distribution. The large blue dot shows the modelling results for the case where β2 = 1. The secular evolution values need to be fixed for studying environmental effects. For the fixing we used the values depicted with the black dot.
Current usage metrics show cumulative count of Article Views (full-text article views including HTML views, PDF and ePub downloads, according to the available data) and Abstracts Views on Vision4Press platform.
Data correspond to usage on the plateform after 2015. The current usage metrics is available 48-96 hours after online publication and is updated daily on week days.
Initial download of the metrics may take a while.