Fig. 4.
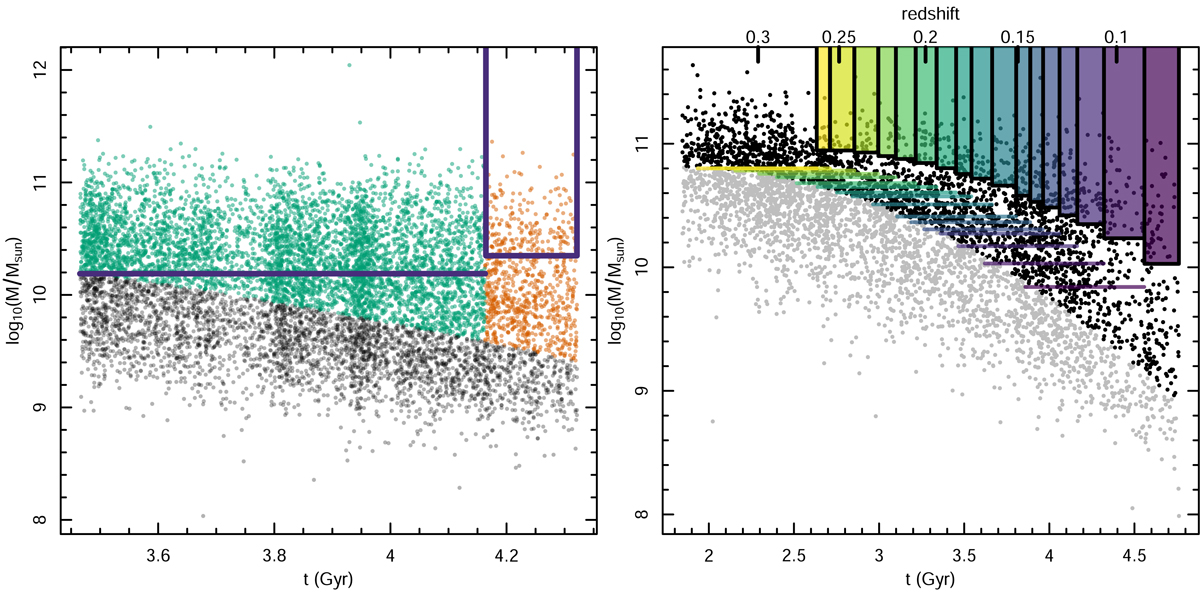
Construction of a locally volume-limited galaxy sample. Left hand panel: an example of a small volume-limited sample is shown, which is used as the unit sample set for modelling galaxy evolution. The horizontal line indicates the redshift range of galaxies that are used to generate the PDF (see Sect. 2.2); the vertical positioning of the line shows the mass-completeness limit. The purple box defines the region used for evaluating the PDF. The vertical gap ΔMcomplete between them shows the maximum evolution that can be modelled with this configuration (see the main text for more explanations). Right hand panel: modelling elements denoted with different colours. In both panels, the grey points represent a (subsample) of the GAMA galaxies in that redshift range.
Current usage metrics show cumulative count of Article Views (full-text article views including HTML views, PDF and ePub downloads, according to the available data) and Abstracts Views on Vision4Press platform.
Data correspond to usage on the plateform after 2015. The current usage metrics is available 48-96 hours after online publication and is updated daily on week days.
Initial download of the metrics may take a while.