Fig. 2.
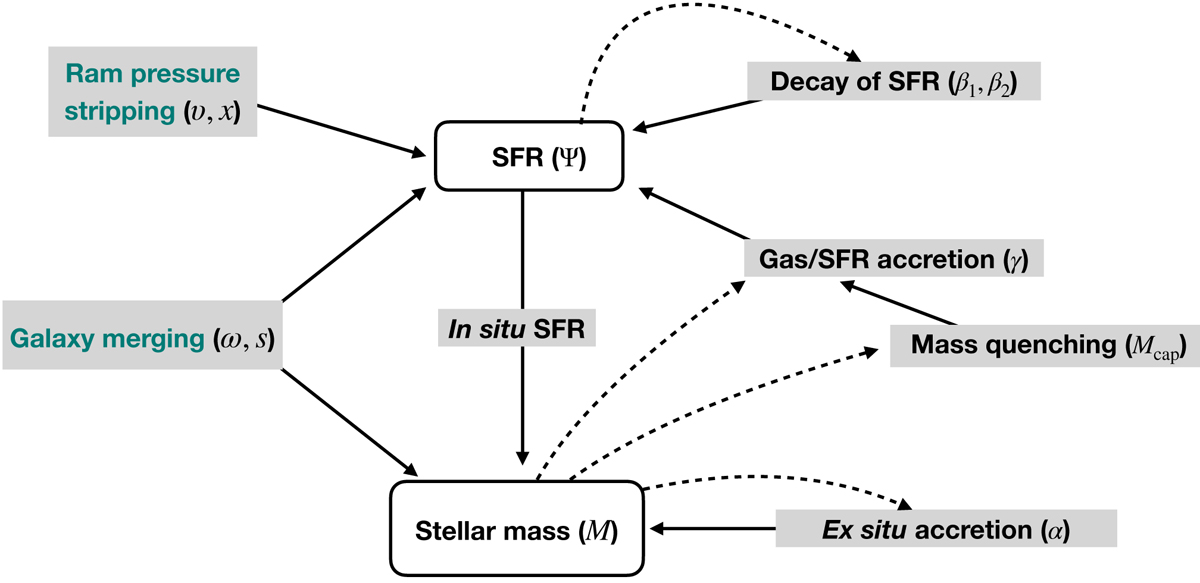
Schema showing the relations between observables (in boxes) and processes (texts with grey background). The green text within the grey box indicates that the process is stochastic and black indicates it is smooth. The solid arrows show which of the observables are influenced by these processes, and dashed arrows show that the observable galaxy parameter influences the process itself.
Current usage metrics show cumulative count of Article Views (full-text article views including HTML views, PDF and ePub downloads, according to the available data) and Abstracts Views on Vision4Press platform.
Data correspond to usage on the plateform after 2015. The current usage metrics is available 48-96 hours after online publication and is updated daily on week days.
Initial download of the metrics may take a while.