Fig. 1.
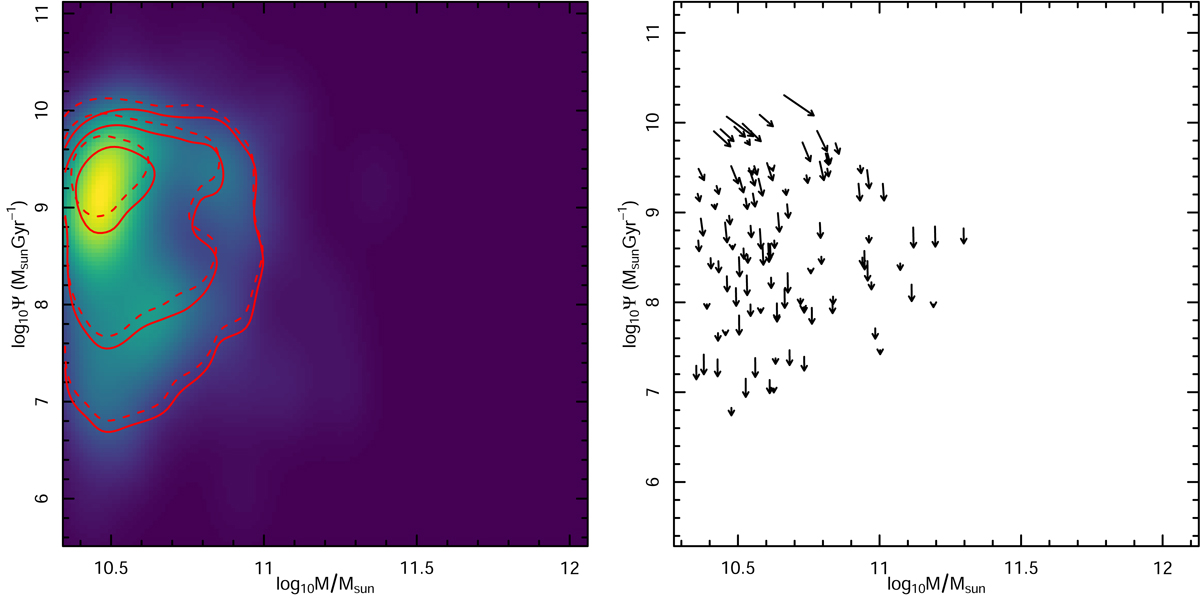
Illustration of the method in the stellar mass and SFR plane. Left panel: dashed red lines show the distribution of galaxies at an intermediate redshift. The solid red lines show the distribution of galaxies at slightly lower redshift. The colour in the background shows smoothed and continuous distribution of these points. We infer that when constructing an evolution criteria for galaxies (shown as arrows on right panel) that matches the change of distributions on the left panel, we can infer the evolution of galaxies.
Current usage metrics show cumulative count of Article Views (full-text article views including HTML views, PDF and ePub downloads, according to the available data) and Abstracts Views on Vision4Press platform.
Data correspond to usage on the plateform after 2015. The current usage metrics is available 48-96 hours after online publication and is updated daily on week days.
Initial download of the metrics may take a while.