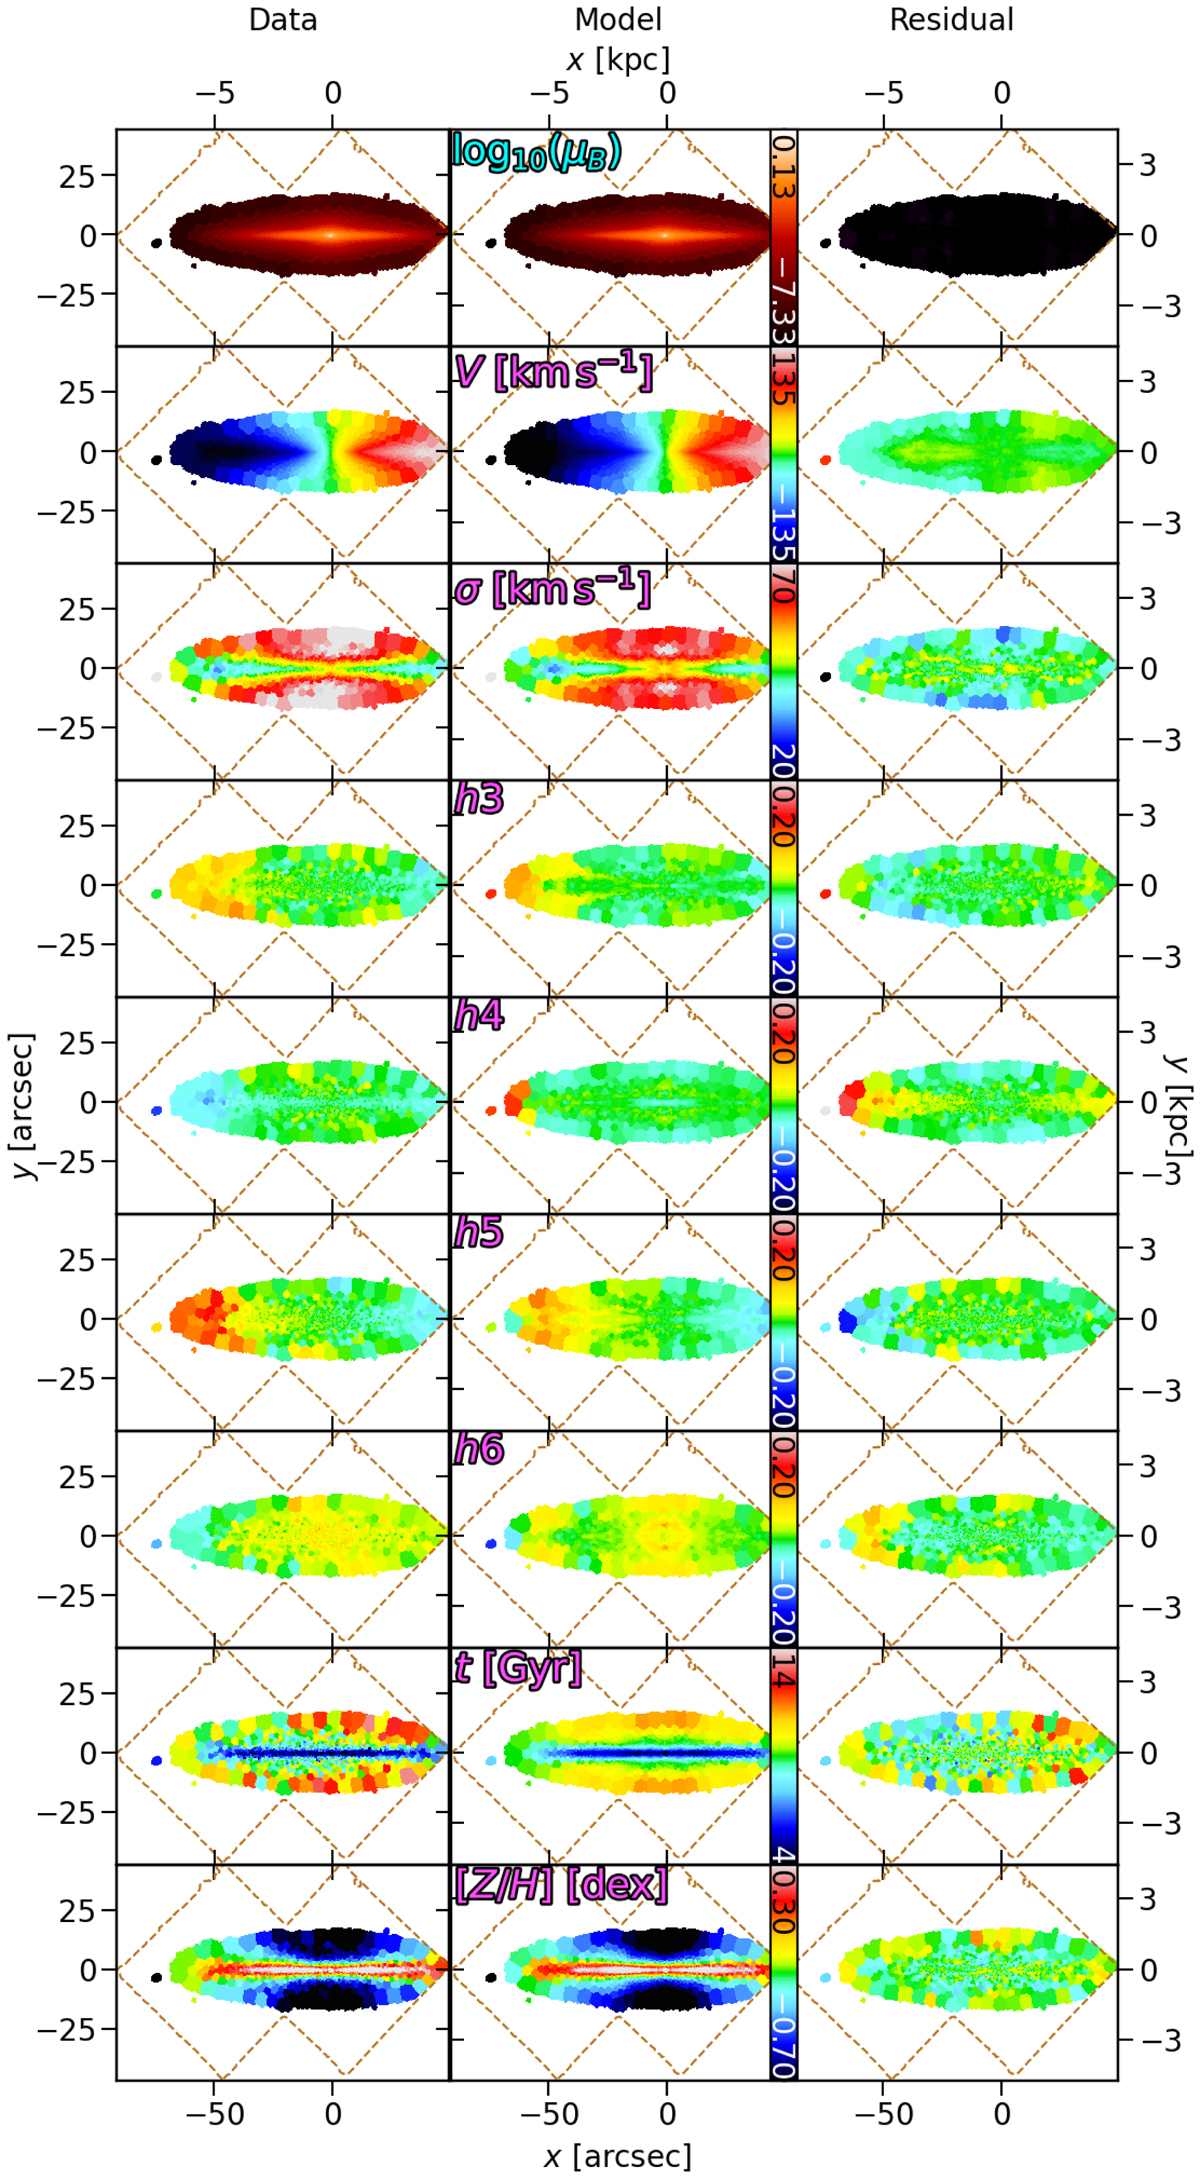
Fig. 7.
Best-fitting Schwarzschild model for FCC 153. The data (left), fits (middle), and residuals (right) of, from top to bottom, the dynamical model (surface brightness, velocity, velocity dispersion, and h3 − h6), and the subsequent stellar-population fitting (age and metallicity). The outline of the MUSE mosaic is shown in dashed brown. All residual panels show the absolute differences (data – model), but are offset such that green is zero. The stellar-population maps share a common colour-bar between galaxies for comparison. We note that for FCC 153, since the observed metallicity map reaches 0.4 dex along the major axis, and is itself an average through the LOS, we extend the upper bound for the individual components during the stellar-population fitting to 1.0 dex.
Current usage metrics show cumulative count of Article Views (full-text article views including HTML views, PDF and ePub downloads, according to the available data) and Abstracts Views on Vision4Press platform.
Data correspond to usage on the plateform after 2015. The current usage metrics is available 48-96 hours after online publication and is updated daily on week days.
Initial download of the metrics may take a while.