Fig. 3.
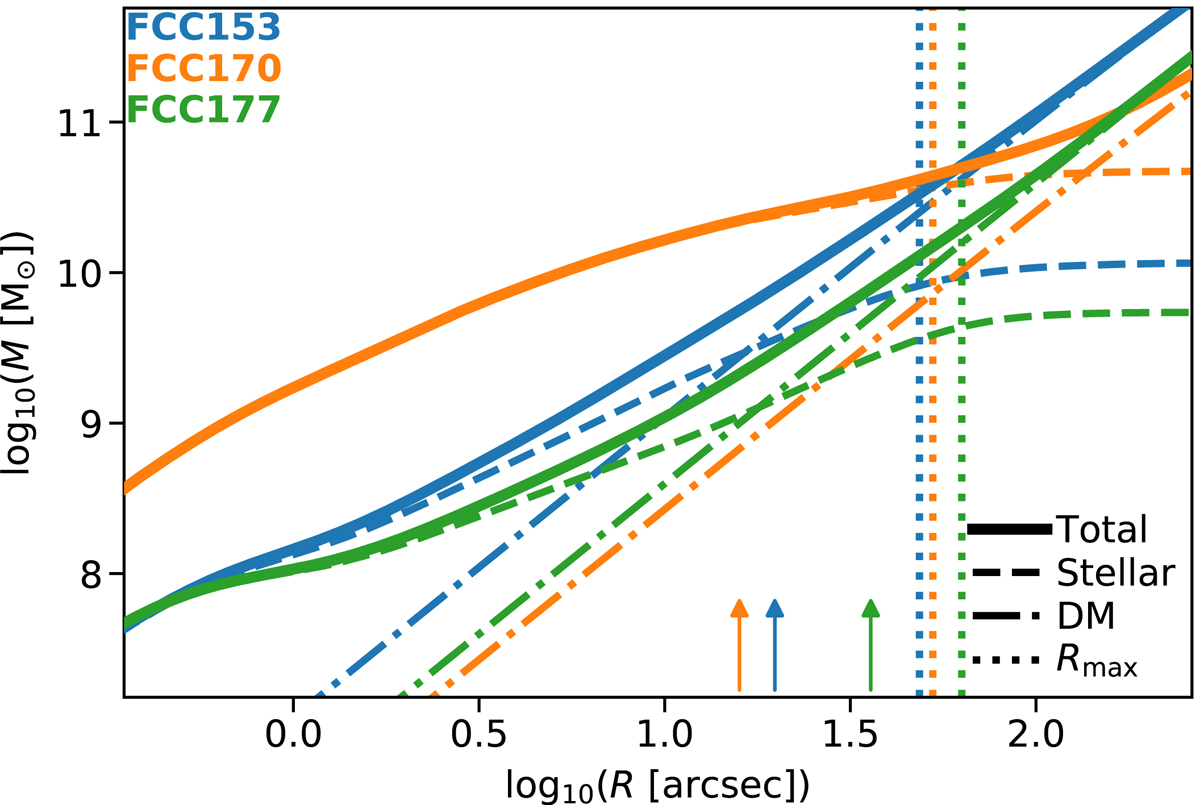
Enclosed-mass profiles of the total (dynamical) mass (solid line), stellar mass (dashed line), and DM (dot-dashed line) for the three galaxies. The effective radii are denoted by the small arrows, and the radial extent of each spectroscopic FOV is shown by the vertical dotted line. The lower radial bound of the figure is set to half the width of the point-spread function from the spectroscopic observations.
Current usage metrics show cumulative count of Article Views (full-text article views including HTML views, PDF and ePub downloads, according to the available data) and Abstracts Views on Vision4Press platform.
Data correspond to usage on the plateform after 2015. The current usage metrics is available 48-96 hours after online publication and is updated daily on week days.
Initial download of the metrics may take a while.