Fig. 13.
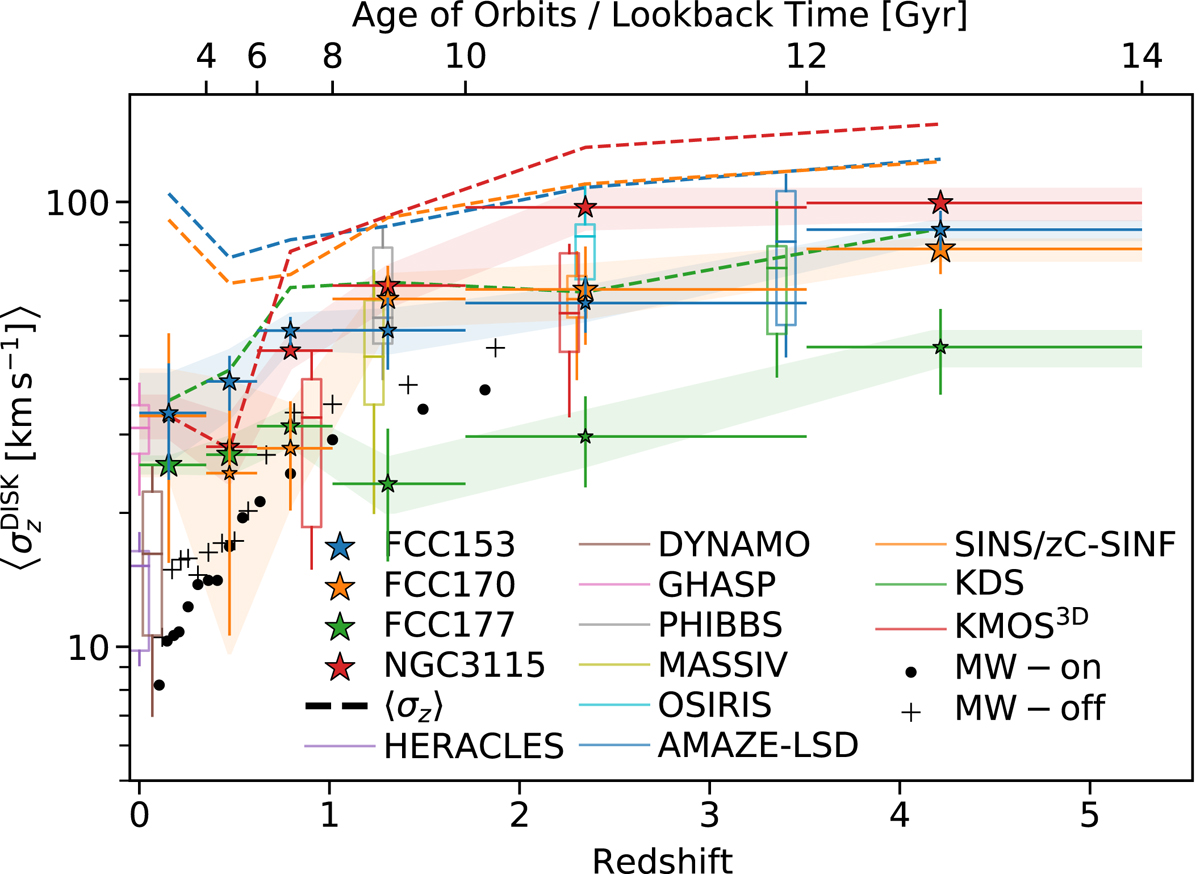
Stellar disk AVR as derived from our models. The coloured stars are the galaxies modelled in this work (and Poci et al. 2019, for NGC 3115). The symbol size is proportional to the fractional stellar mass in each age bin, for each galaxy independently. The horizontal error-bars denote the width of the age bin. The vertical error bars are computed as the weighted standard deviation within each age bin, for the best-fit model. The shaded regions show the spread in σz for 100 Monte Carlo fits to the stellar-population maps. The dashed curves show the stellar AVR of the four S0 galaxies when all orbits are included (no selection on orbital circularity). The box-whisker plots are literature measurements of cold gas disks, from HERACLES (Leroy et al. 2009), DYNAMO (Green et al. 2014), GHASP (Epinat et al. 2010), PHIBBS (Tacconi et al. 2013), MASSIV (Epinat et al. 2012), OSIRIS (Law et al. 2009), AMAZE-LSD (Gnerucci et al. 2011), SINS (Schreiber et al. 2009) and zC-SINF (Schreiber et al. 2014), KMOS3D (Wisnioski et al. 2015), and KDS (Turner et al. 2017). The black dots and crosses are Milky-Way stellar measurements (Yu & Liu 2018) for stars on (|z| < 270 pc) and off (|z| > 270 pc) the plane, respectively. Galaxy disks become dynamically colder towards the present day. The cluster S0 galaxies have a higher contribution from warmer orbits at more recent times compared to the field galaxy (comparing the full and disk-only σz). The Milky-Way, despite its higher stellar mass, is dynamically colder than the S0 galaxies studied here.
Current usage metrics show cumulative count of Article Views (full-text article views including HTML views, PDF and ePub downloads, according to the available data) and Abstracts Views on Vision4Press platform.
Data correspond to usage on the plateform after 2015. The current usage metrics is available 48-96 hours after online publication and is updated daily on week days.
Initial download of the metrics may take a while.