Fig. 10.
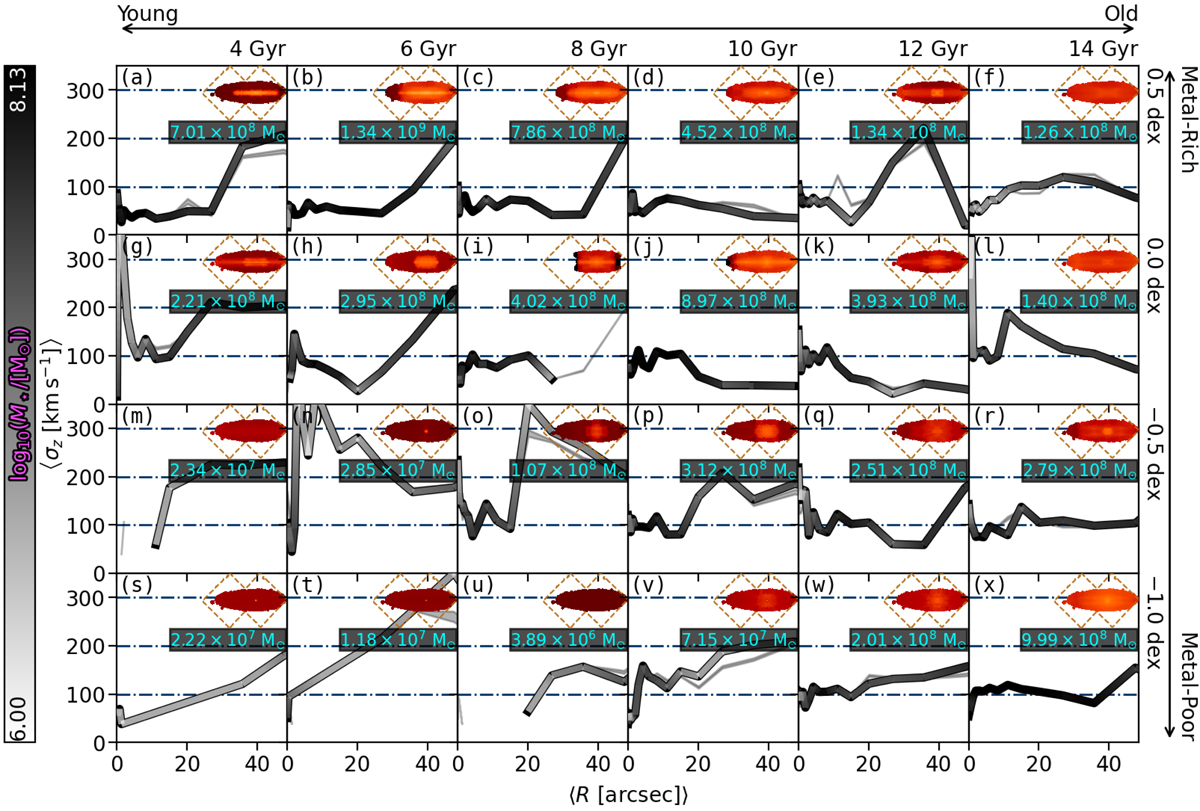
Mass assembly history for FCC 153. The panels are ordered by increasing mean stellar age (left to right) and decreasing mean stellar metallicity (top to bottom). The value given at the top and right of each column and row, respectively, denotes its upper bound (inclusive). Each panel is composed of a radial profile of the vertical stellar velocity dispersion σz (black/white curve), the surface brightness distribution at the best-fitting projection (top-right) with the outline of the MUSE mosaic shown in dashed brown, and the total stellar mass within the FOV for that panel. The σz(R) profiles are coloured according to the stellar mass in that panel at that radius (sampled within the logarithmic radial bins). This indicates the spatial region in which each curve contributes most (white regions), and which regions may be impacted by numerical noise (black regions). The grey shaded regions show the spread of velocity dispersion profiles for 100 Monte Carlo fits to the stellar-population maps. This galaxy exhibits a dominant disk-like, metal-rich component that has steadily formed over the last ∼ 10 Gyr.
Current usage metrics show cumulative count of Article Views (full-text article views including HTML views, PDF and ePub downloads, according to the available data) and Abstracts Views on Vision4Press platform.
Data correspond to usage on the plateform after 2015. The current usage metrics is available 48-96 hours after online publication and is updated daily on week days.
Initial download of the metrics may take a while.