Open Access
Fig. C.1.
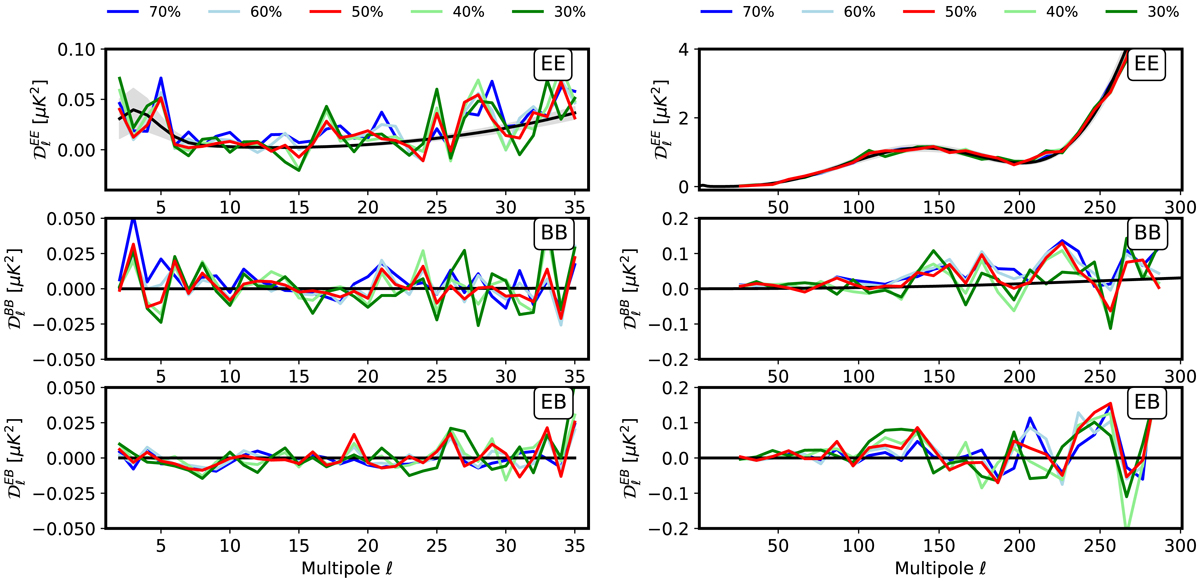
EE, BB, and EB power spectra computed from the PR4 maps for sky fractions from 30 to 70%. The black lines represent the ΛCDM model and the grey bands show its associated full-sky cosmic variance.
Current usage metrics show cumulative count of Article Views (full-text article views including HTML views, PDF and ePub downloads, according to the available data) and Abstracts Views on Vision4Press platform.
Data correspond to usage on the plateform after 2015. The current usage metrics is available 48-96 hours after online publication and is updated daily on week days.
Initial download of the metrics may take a while.