Fig. 5.
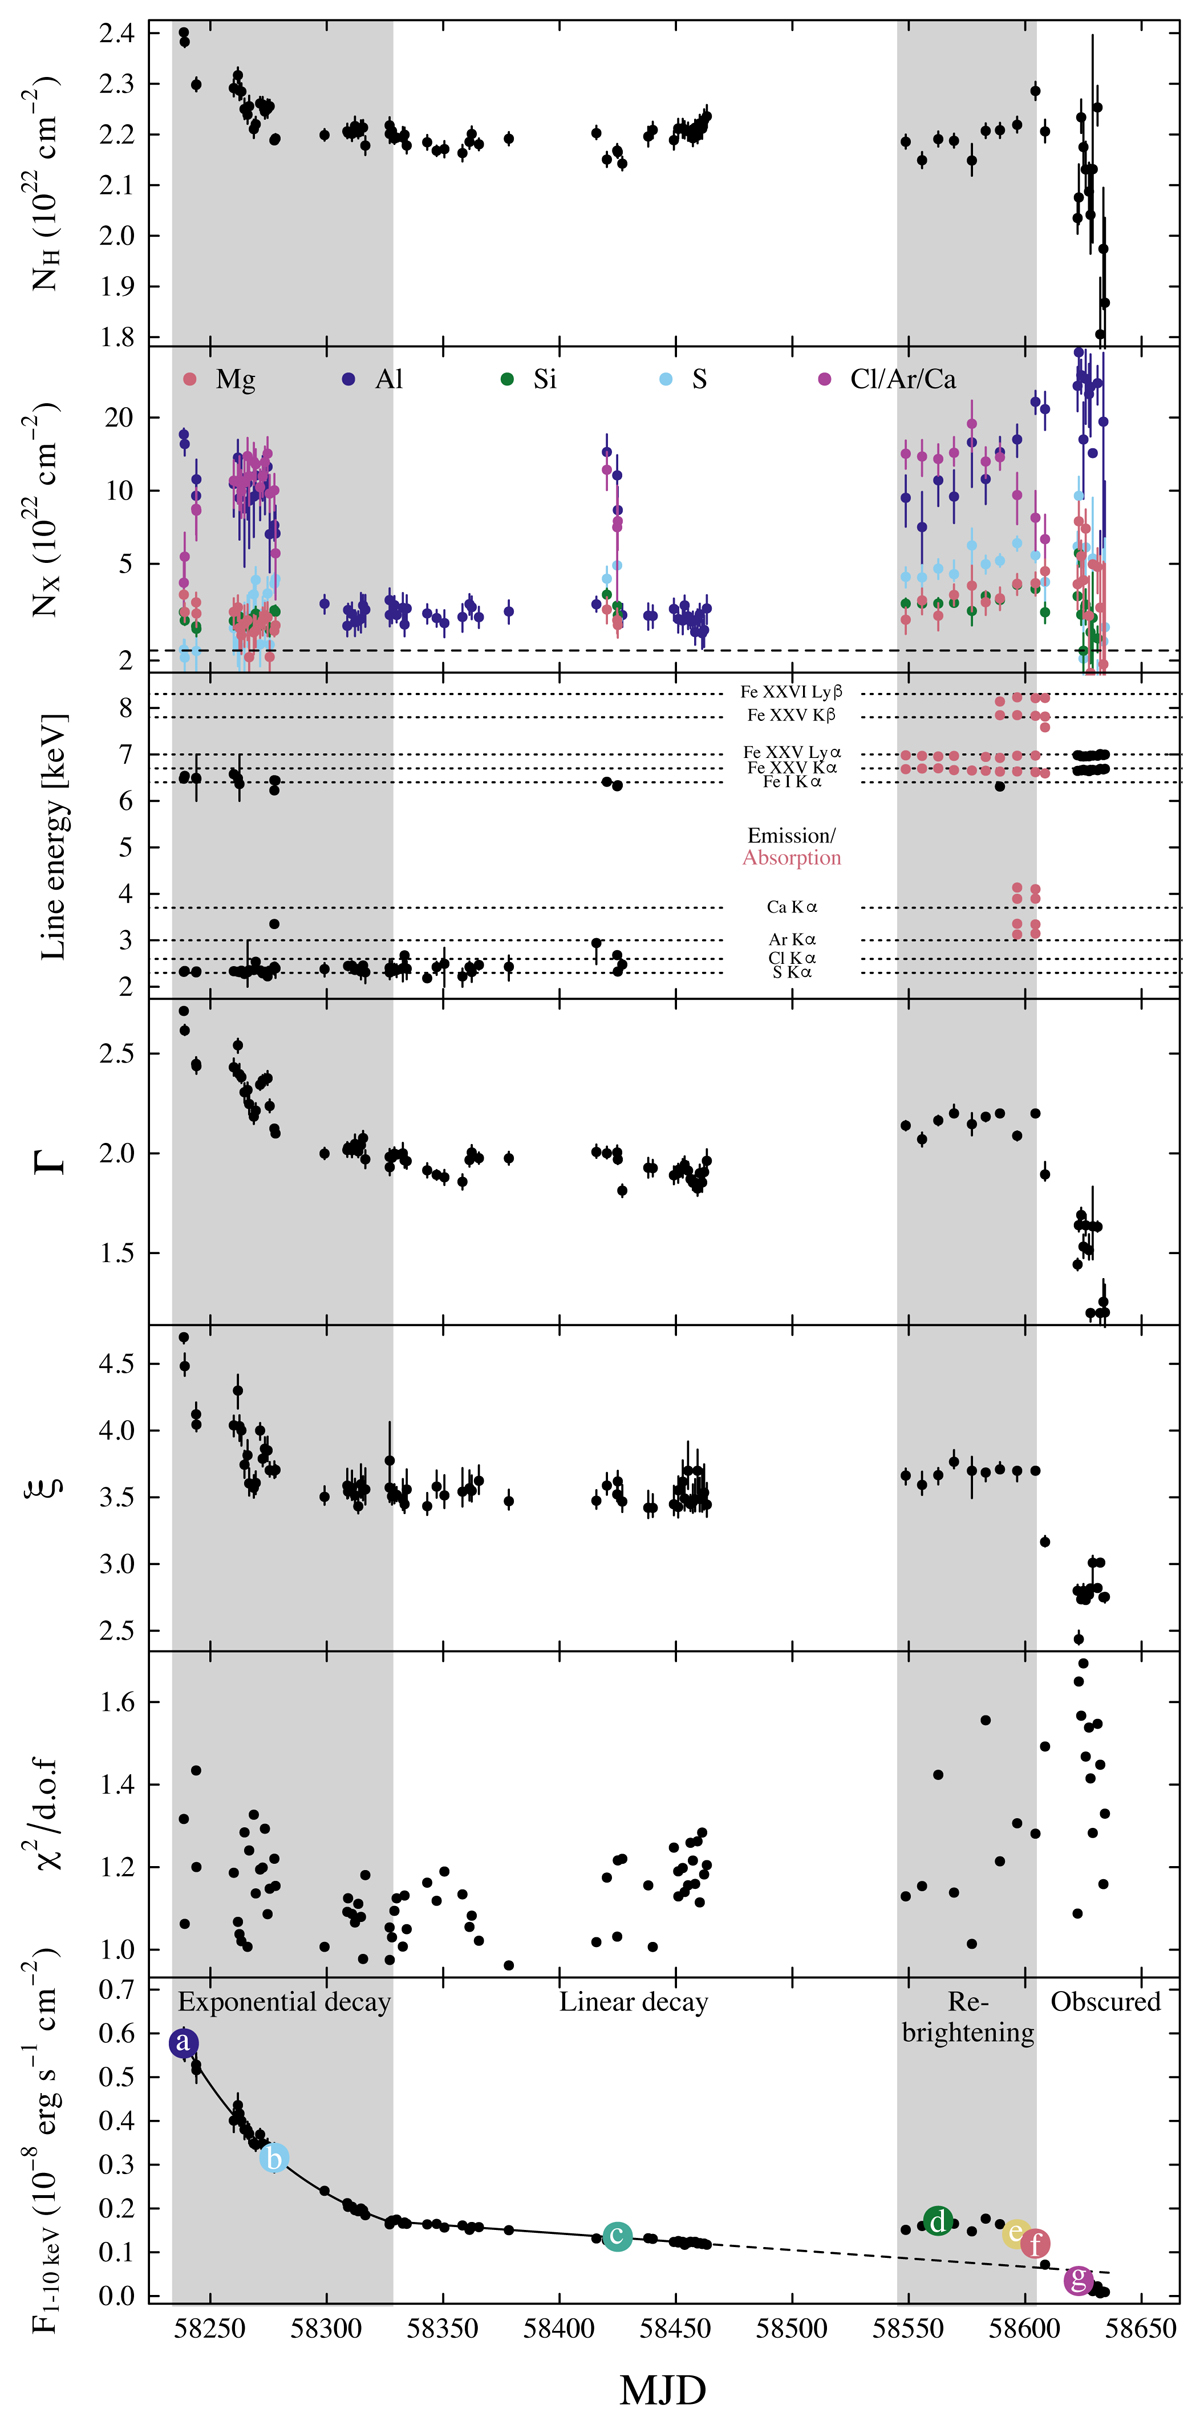
Spectral fit results of the NICER data. From top to bottom: model parameter evolution is shown for the abundance of lighter elements (lighter than magnesium all fixed to the same value), heavier elements (Mg, Al, Si, S, and Cl/Ar/Ca displayed with different colors), line energies for the emission/absorption lines (displayed with different colors), the photon power law index (Γ), ionization parameter (log ξ), the corresponding fit quality (χ2/d.o.f.), and the absorbed 1–10 keV flux density with the colored letters corresponding to spectra shown in Fig. 6. The alternate shading shows the times of the different decay phases.
Current usage metrics show cumulative count of Article Views (full-text article views including HTML views, PDF and ePub downloads, according to the available data) and Abstracts Views on Vision4Press platform.
Data correspond to usage on the plateform after 2015. The current usage metrics is available 48-96 hours after online publication and is updated daily on week days.
Initial download of the metrics may take a while.