Fig. 2.
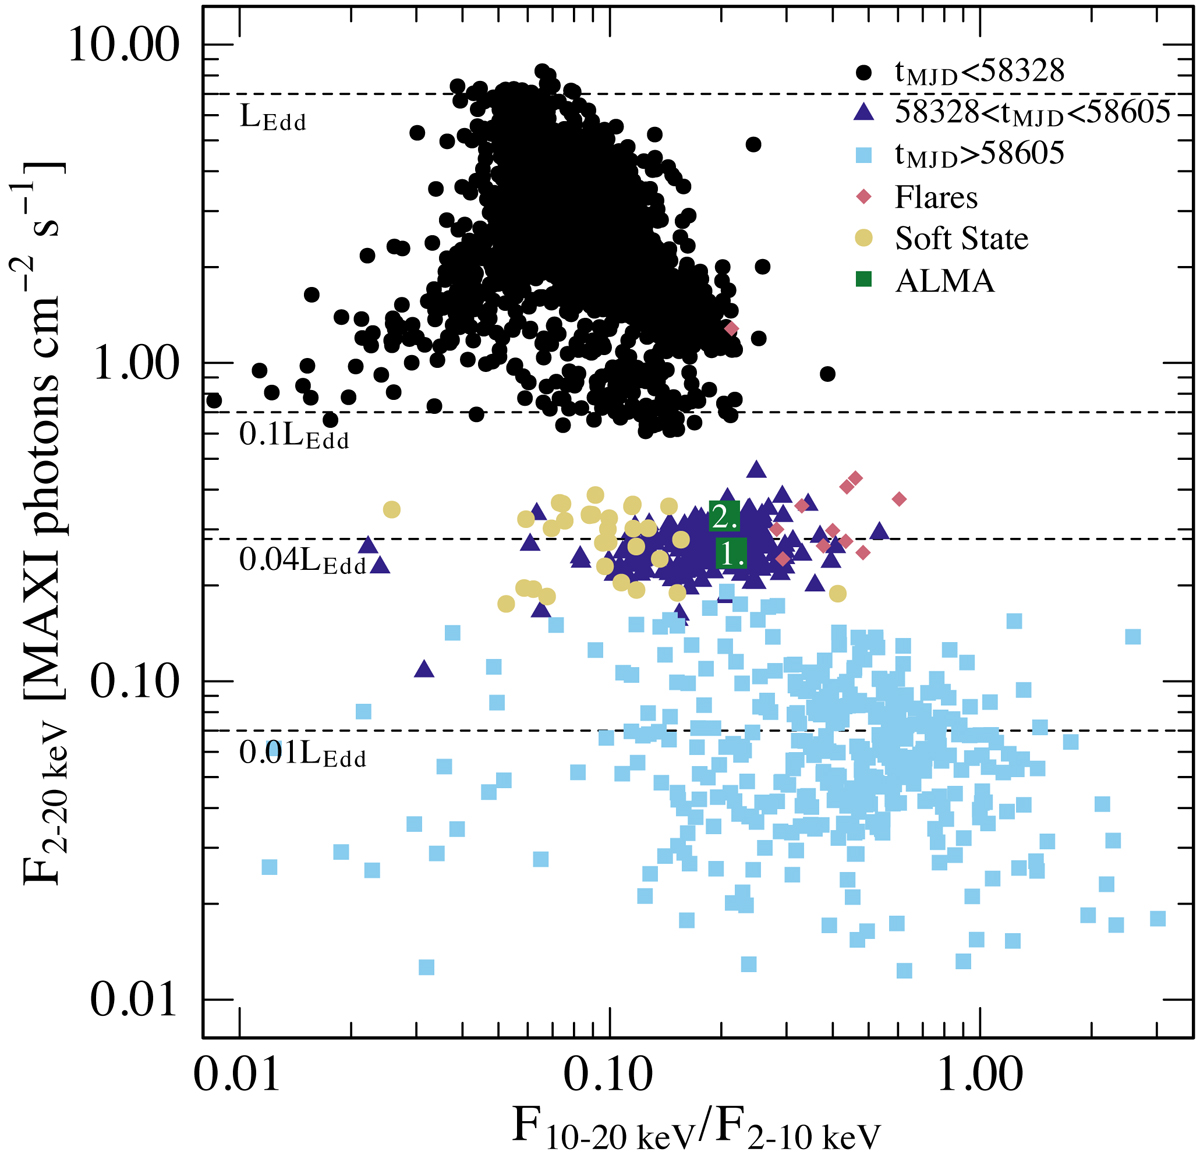
MAXI/GSC hardness-intensity diagram of GRS 1915+105 from daily monitoring observations since August 2009. The blue data points (both dark triangles and light blue squares) indicate the low-luminosity state since August 2018 with increased spectral hardness. The light blue squares correspond to the obscured decay phase with even lower flux densities and harder spectra with occasional, strong X-ray flares (red diamonds) and highly variable radio emission, in addition to a softer state in August–September 2020 with the flux densities back to the level of the low-luminosity state (yellow dots). The numbered green boxes correspond to the ALMA epochs that took place during the linear and rebrightening decay phases of the outburst decay.
Current usage metrics show cumulative count of Article Views (full-text article views including HTML views, PDF and ePub downloads, according to the available data) and Abstracts Views on Vision4Press platform.
Data correspond to usage on the plateform after 2015. The current usage metrics is available 48-96 hours after online publication and is updated daily on week days.
Initial download of the metrics may take a while.