Fig. B.1.
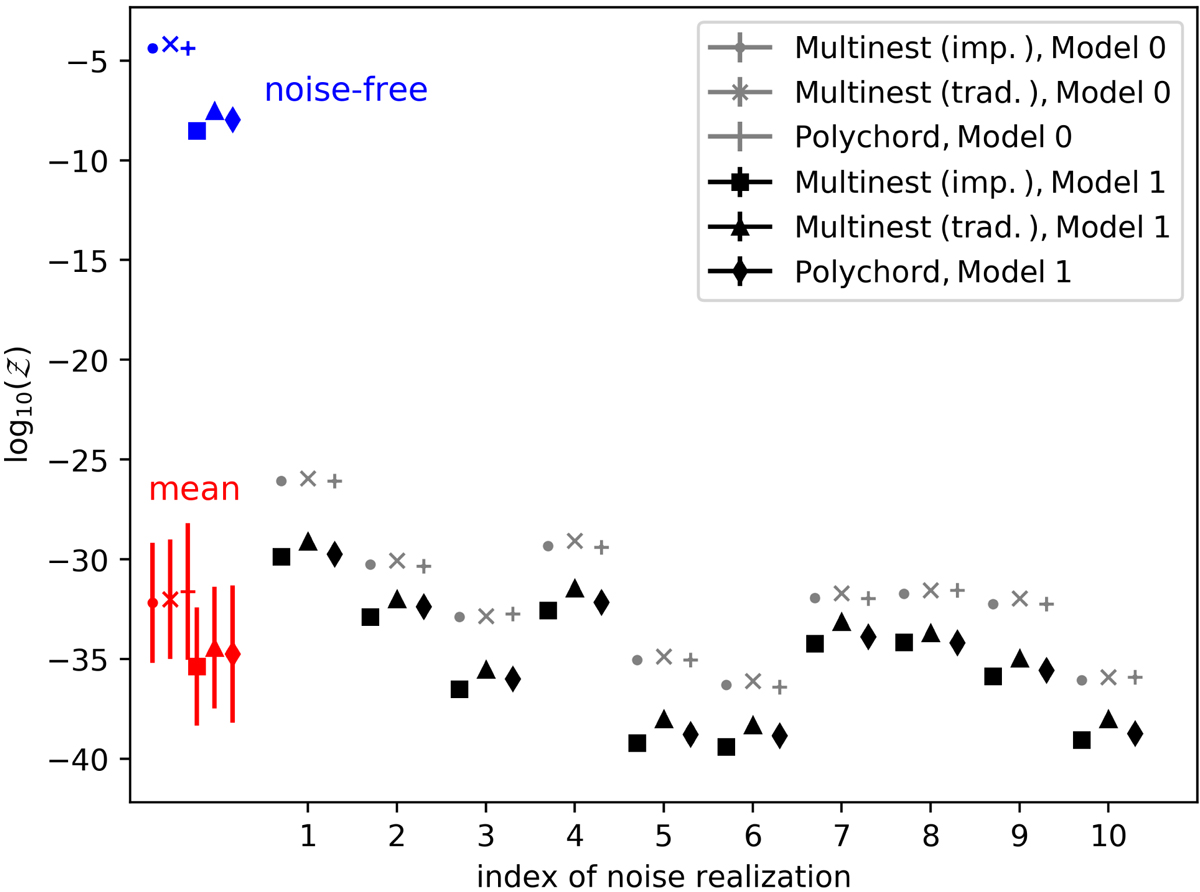
Comparison of sampler outputs. Black points correspond to the evidence of the joint analysis (Model 0), while grey points correspond to split analysis (Model 1) for ten noise realisations measured from the traditional or importance-sampled approaches of MULTINEST, as well as from POLYCHORD. Red points display the mean and standard deviation over these realisations. Blue points show results for a noise-free data vector.
Current usage metrics show cumulative count of Article Views (full-text article views including HTML views, PDF and ePub downloads, according to the available data) and Abstracts Views on Vision4Press platform.
Data correspond to usage on the plateform after 2015. The current usage metrics is available 48-96 hours after online publication and is updated daily on week days.
Initial download of the metrics may take a while.