Fig. 3.
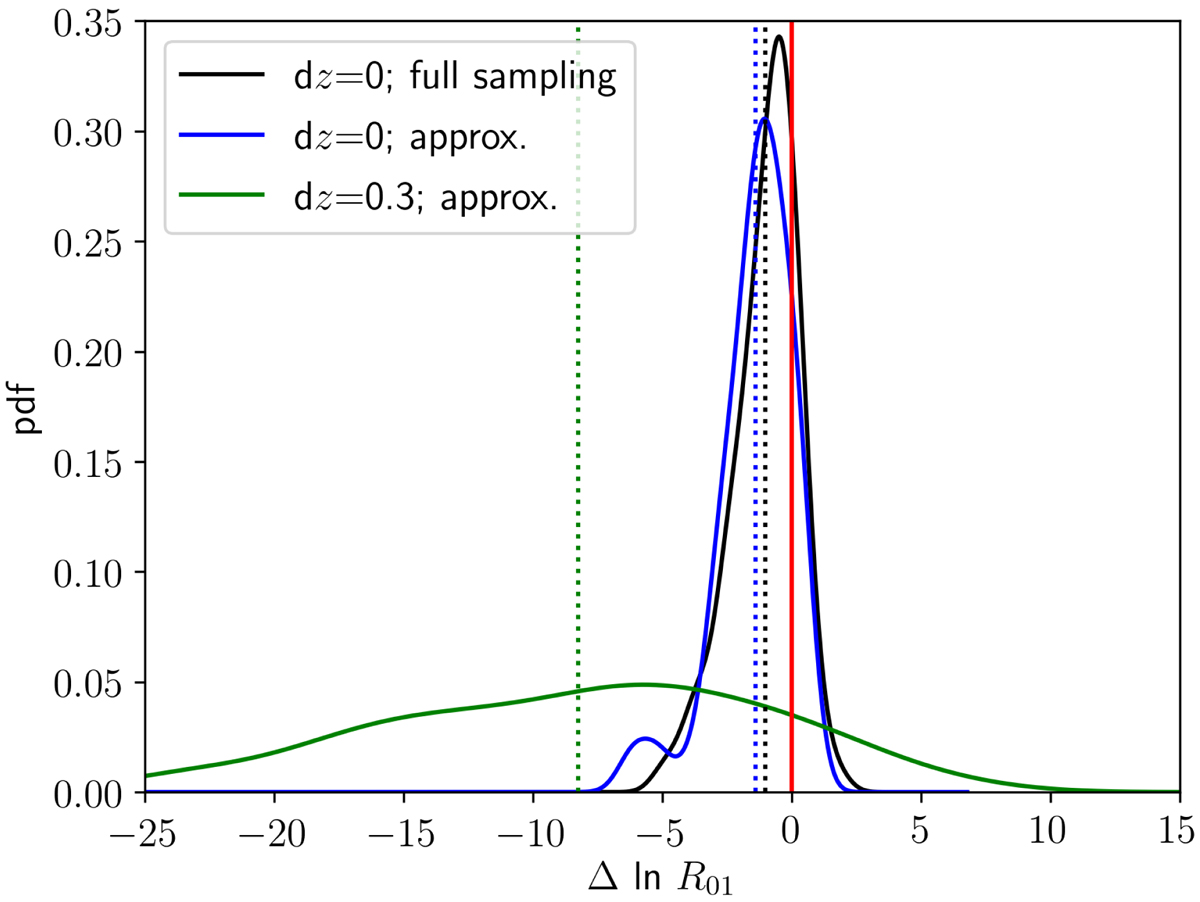
Probability density of the Bayes factor, lnR01, shifted to have its true value at 0. The black curve is the distribution of ΔlnR01 extracted from the full nested sampling analysis, and the blue curve is the distribution extracted from the ![]() approximation from Sect. 3. The green curve corresponds to the highly discrepant case of one of four tomographic redshift bins being shifted by dz = 0.3. Dotted lines mark the mean of each distribution.
approximation from Sect. 3. The green curve corresponds to the highly discrepant case of one of four tomographic redshift bins being shifted by dz = 0.3. Dotted lines mark the mean of each distribution.
Current usage metrics show cumulative count of Article Views (full-text article views including HTML views, PDF and ePub downloads, according to the available data) and Abstracts Views on Vision4Press platform.
Data correspond to usage on the plateform after 2015. The current usage metrics is available 48-96 hours after online publication and is updated daily on week days.
Initial download of the metrics may take a while.