Fig. 2.
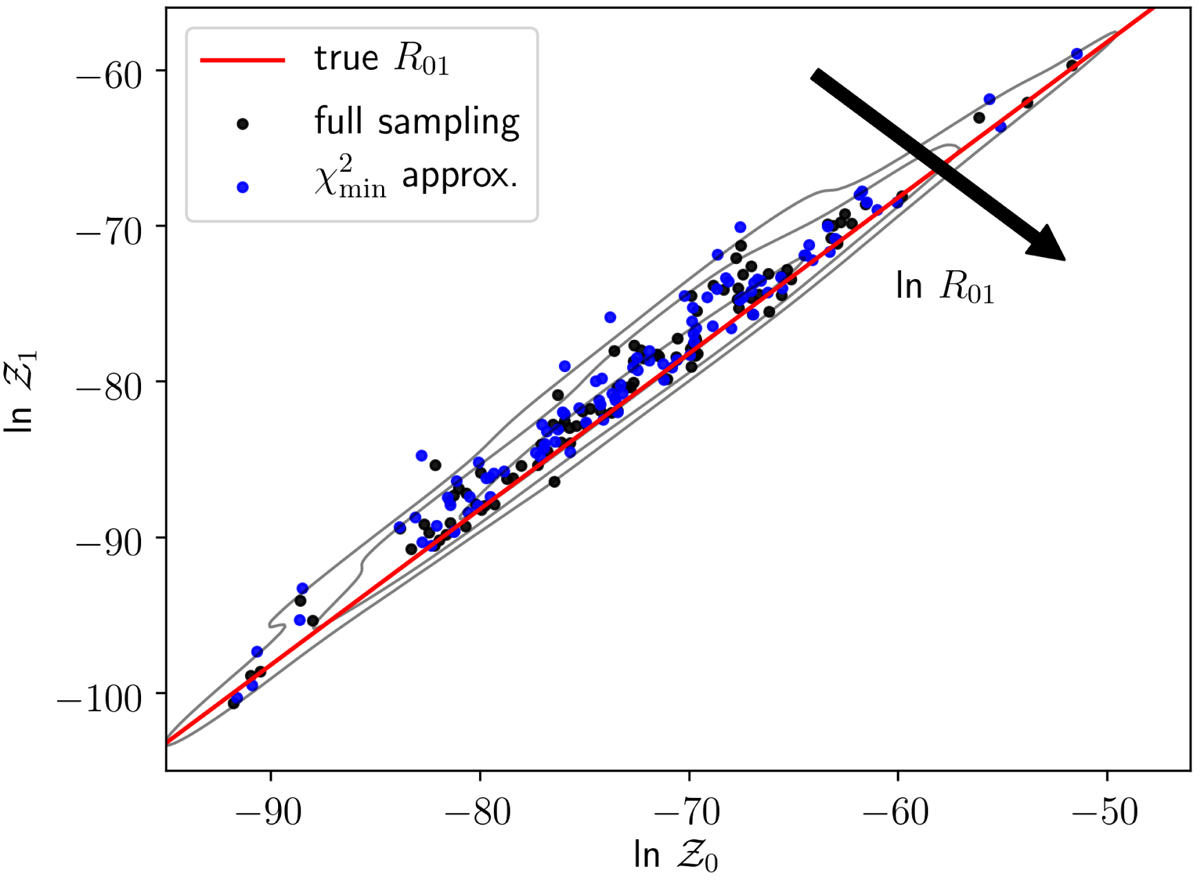
Joint distribution of the evidence calculated under two models (the mock KiDS cosmology analysis for a joint [Model 0] and a split [Model 1] data vector). The arrow indicates the direction of the increasing Bayes factor, lnR01, with the red line marking the true value of R01. Black points correspond to the inferences from 100 noise realisations of the mock data vector, evaluated on the full nested sampling analysis, and the blue points correspond to the ![]() approximation from Sect. 3. Contours show the Gaussian kernel density approximation of the distribution based on the black points.
approximation from Sect. 3. Contours show the Gaussian kernel density approximation of the distribution based on the black points.
Current usage metrics show cumulative count of Article Views (full-text article views including HTML views, PDF and ePub downloads, according to the available data) and Abstracts Views on Vision4Press platform.
Data correspond to usage on the plateform after 2015. The current usage metrics is available 48-96 hours after online publication and is updated daily on week days.
Initial download of the metrics may take a while.