Fig. 1.
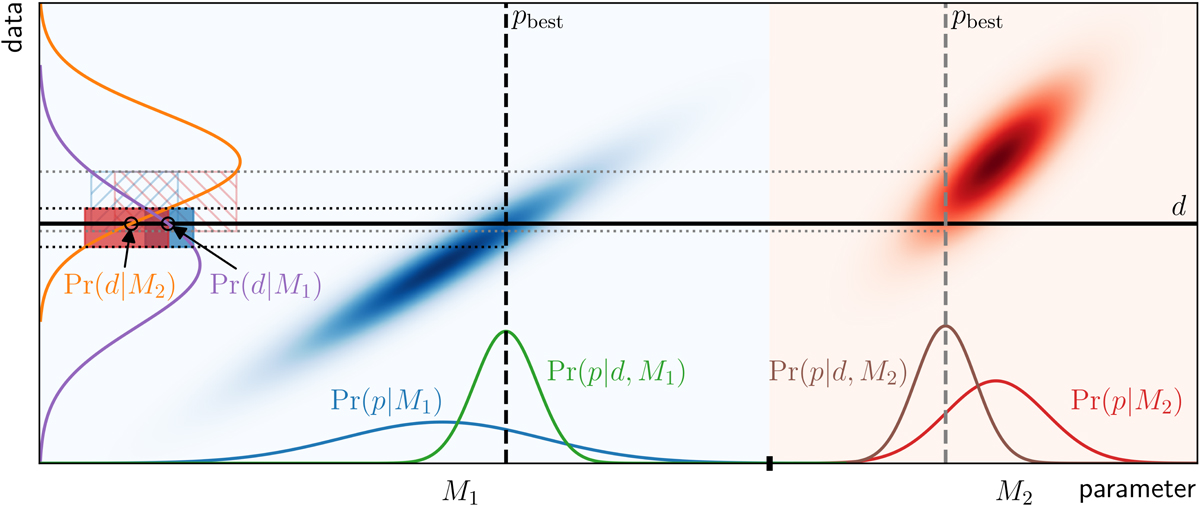
Illustration of model comparison via evidence and of its associated scatter for a one-dimensional data vector d and two models, Mi with i = 1, 2, each with a single parameter p. The joint distributions Pr(d,p|Mi) are shown in blue and red shades. The projections of these distributions onto the parameter and data axes yield the prior Pr(p|Mi) and the evidence or marginal likelihood, respectively (shown in purple and orange for M1 and M2). An experiment produces the observation d, shown as the solid black line. Conditioning on d yields the posterior Pr(p|d,Mi), shown in green and brown for M1 and M2. Evaluating the marginal likelihood at d yields Pr(d|Mi), which is used in the model comparison. The dotted horizontal lines mark the 1σ interval of possible alternative realisations of the data given the best-fit parameter pbest (dashed vertical lines) of either model. The blue and red boxes show the resulting 1σ range in possible evidence values under M1, which has higher evidence in this case (the corresponding ranges for M2 are shown as hatched areas).
Current usage metrics show cumulative count of Article Views (full-text article views including HTML views, PDF and ePub downloads, according to the available data) and Abstracts Views on Vision4Press platform.
Data correspond to usage on the plateform after 2015. The current usage metrics is available 48-96 hours after online publication and is updated daily on week days.
Initial download of the metrics may take a while.