Fig. 9
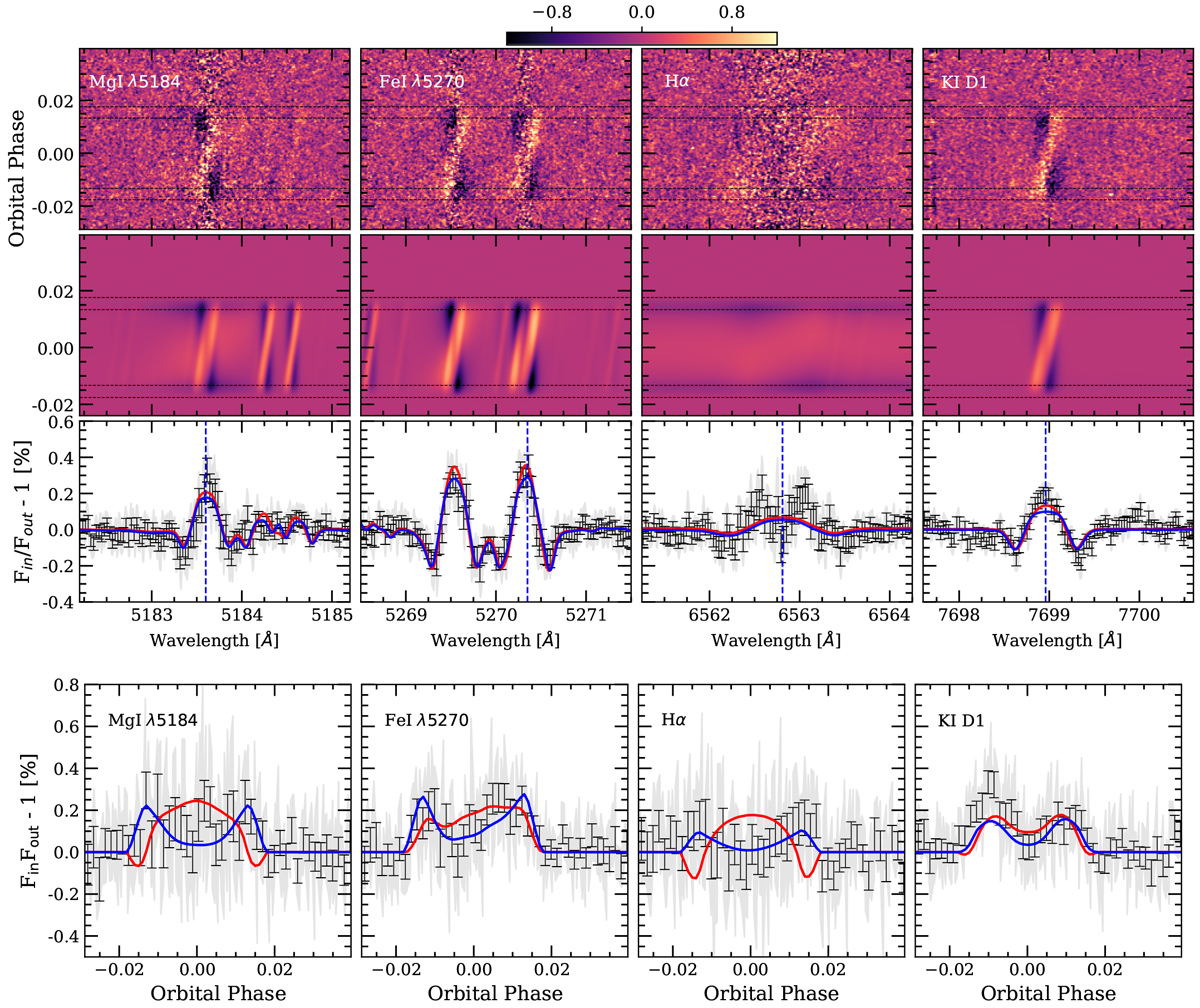
Results around the Mg I λ5184 (first column), Fe I λ5270 (second column), Hα (third column), and K I D1 (fourth column) spectral lines. Top panel, first row: two-dimensional map of the transmission residuals of HD 209458b around different spectral lines. Second row: two-dimensional map of the modelled CLV and RM effects. In both panels the residuals are presented in the stellar rest frame. The black horizontal dashed lines indicate the four contacts of the transit. Third row: transmission spectrum computed in the planet rest frame considering the data between thefirst and fourth contacts of the transit. The original data are shown in light gray and the data binned by 0.03 Å is shown in black. The blue-dashed vertical lines show the laboratory position of the lines. The colour bar shows the relative flux (Fin/Fout-1) in %. Bottom panel: transmission light curves calculated for each line using 0.4 Å bandwidth and 0.5 Å for Hα. In light-grey, we show the original data and in black the data binned by 0.0015 in orbital phase. In both panels, the red and blue lines correspond to the RM model with and without considering the CLV effect, respectively.
Current usage metrics show cumulative count of Article Views (full-text article views including HTML views, PDF and ePub downloads, according to the available data) and Abstracts Views on Vision4Press platform.
Data correspond to usage on the plateform after 2015. The current usage metrics is available 48-96 hours after online publication and is updated daily on week days.
Initial download of the metrics may take a while.