Fig. 8
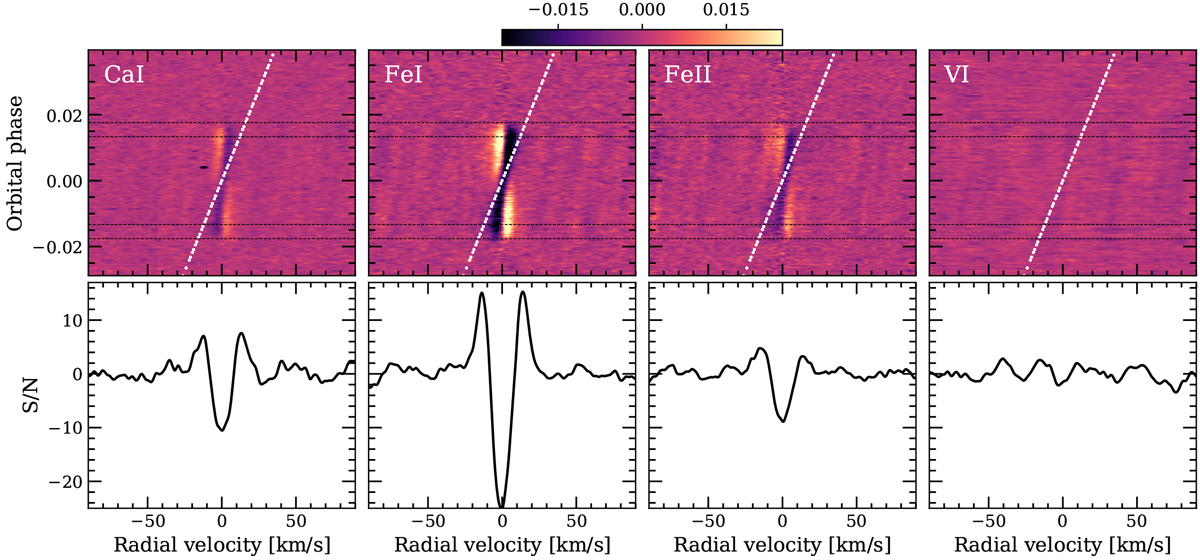
Cross-correlation results of both nights combined for Ca I, Fe I, Fe II, and V I (from left to right, respectively). Top panel: cross-correlation maps of the three different species. Bottom panel: average of the in-transit cross-correlation values in the planet rest frame between the first and fourth contacts. The y-axis is shown in S/N units, where negative values mean anti-correlation (see the cross-correlation coefficients in the colour bar).
Current usage metrics show cumulative count of Article Views (full-text article views including HTML views, PDF and ePub downloads, according to the available data) and Abstracts Views on Vision4Press platform.
Data correspond to usage on the plateform after 2015. The current usage metrics is available 48-96 hours after online publication and is updated daily on week days.
Initial download of the metrics may take a while.