Fig. 7
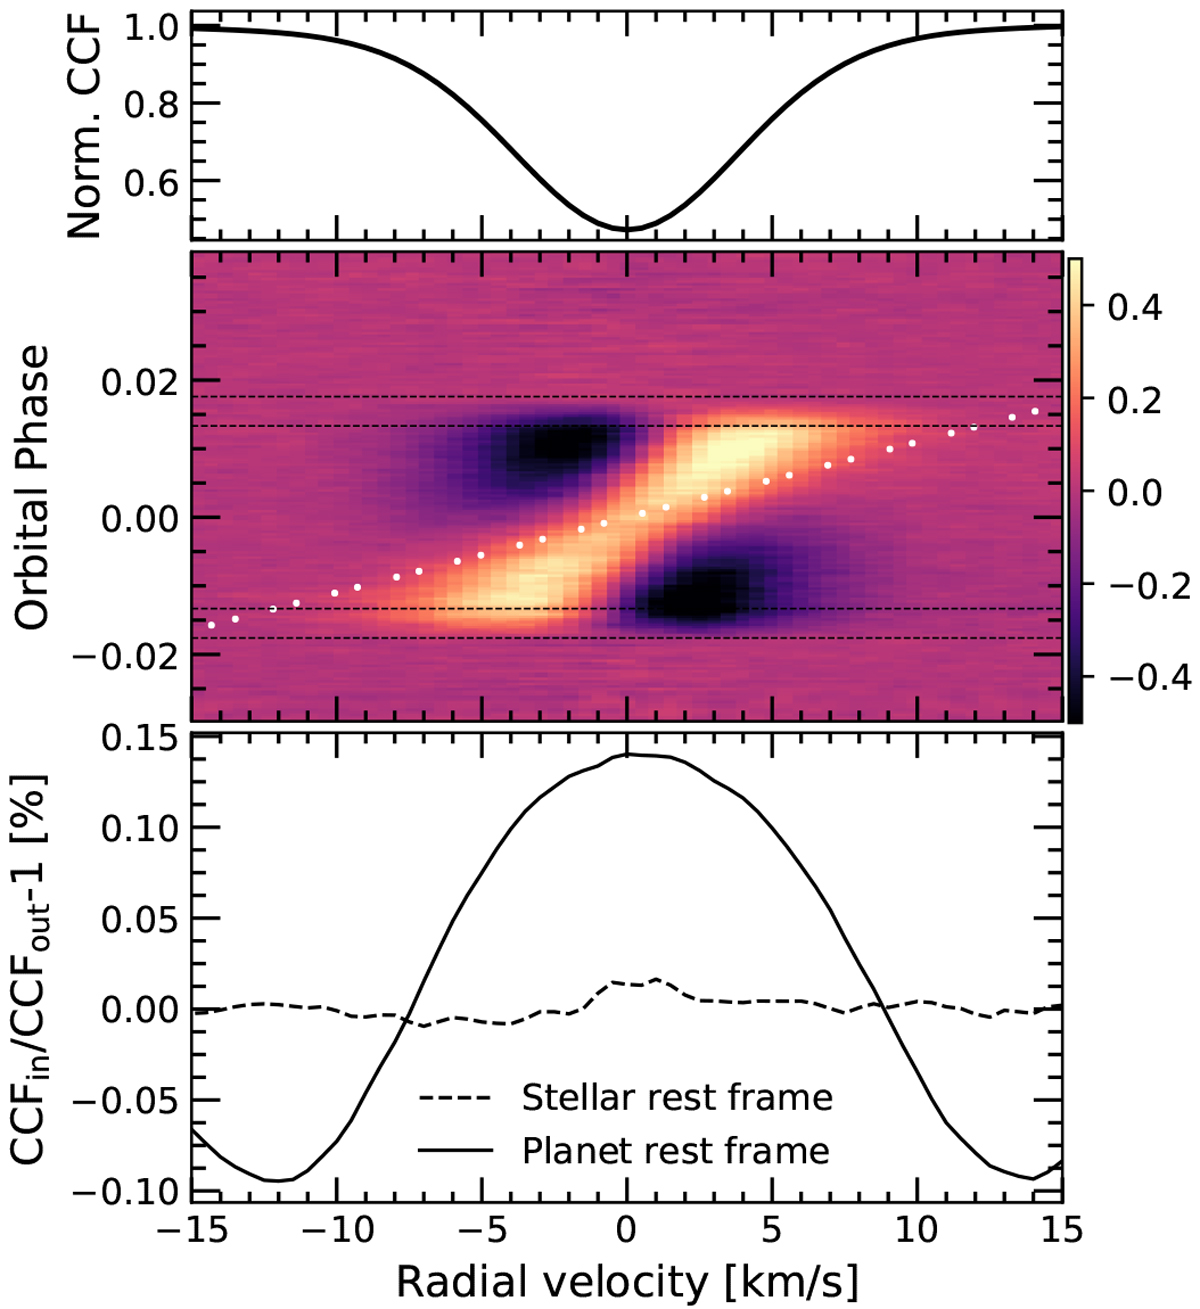
Top panel: average out-of-transit stellar CCF. Middle panel: tomography of the CCFs deformation for the two transits combined in the stellar rest frame. The dotted white line indicates the planet radial velocities and the black horizontal dashed lines show the four contacts of the transit. The colour bar shows the relative variation of the CCFs with respect the combined out-of-transit CCF in %. Bottom panel: combination of the CCF residuals from the middle panel in the stellar rest frame (dashed line) and in the planet rest frame (solid line) between the first and fourth contact.
Current usage metrics show cumulative count of Article Views (full-text article views including HTML views, PDF and ePub downloads, according to the available data) and Abstracts Views on Vision4Press platform.
Data correspond to usage on the plateform after 2015. The current usage metrics is available 48-96 hours after online publication and is updated daily on week days.
Initial download of the metrics may take a while.