Fig. 5
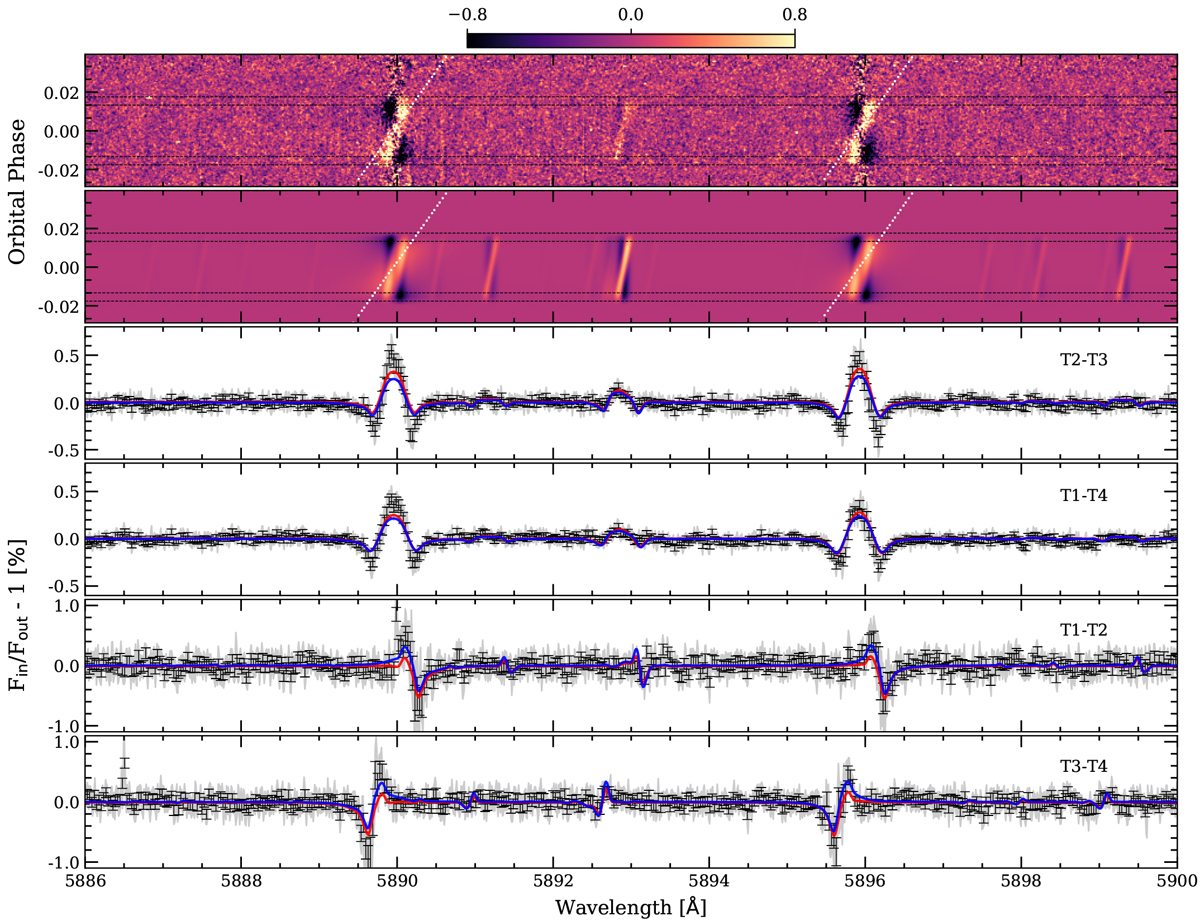
First panel (top): two-dimensional map of the individual transmission spectra around the Na I doublet lines of HD 209458b. Second panel: two-dimensional map of the modelled CLV and RM effects around the Na I doublet. In both panels, the results are presented in the stellar rest frame and the colour bar shows the relative flux (Fin /Fout-1) in %. Theblack horizontal dashed lines indicate the four contacts of the transit and the dotted white line marks the expected position of the planet trail during the observations. Third panel: transmission spectrum computed combining the data between the second and third contacts of the transit. Fourth panel: combination of the in-transit exposures from the first to fourth contacts. Fifth panel: combination of ingress exposures. Sixth panel (bottom): combination of egress exposures. The transmission spectra are computed combining the data in the planet rest frame. The original data error bars are shown in light grey and the data binned by 0.03 Å is shown in black. We note the different y-scale in the different panels. In red, we show the CLV and RM effects in the final transmission spectrum and in blue, the deformation due to the RM alone.
Current usage metrics show cumulative count of Article Views (full-text article views including HTML views, PDF and ePub downloads, according to the available data) and Abstracts Views on Vision4Press platform.
Data correspond to usage on the plateform after 2015. The current usage metrics is available 48-96 hours after online publication and is updated daily on week days.
Initial download of the metrics may take a while.