Fig. 4
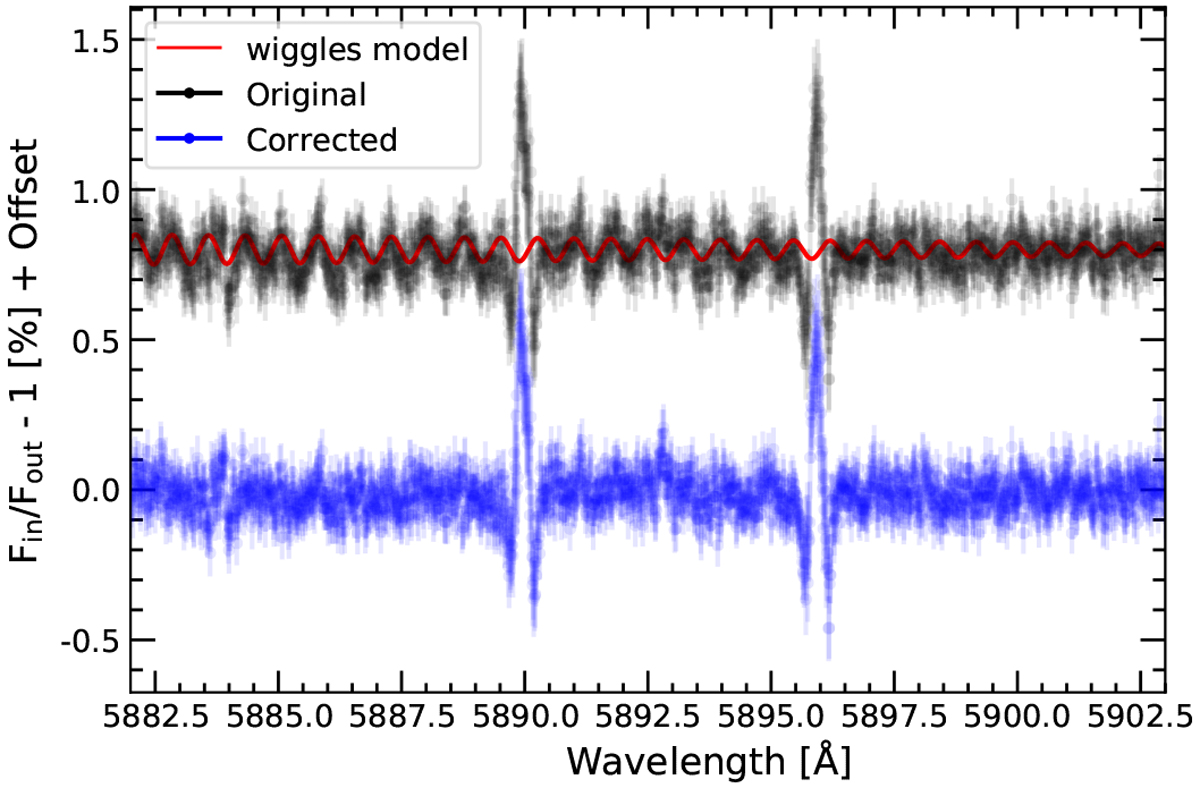
Correction of the interference pattern in the final mid-transit transmission spectrum of the first night (2019 July 20). The original transmission spectrum in shown in black and the corrected transmission spectrum is shown in blue. In red and on-top of the uncorrected spectrum, we show the best fit sinusoidal curve. An offset between the two spectra is added for a better visualisation.
Current usage metrics show cumulative count of Article Views (full-text article views including HTML views, PDF and ePub downloads, according to the available data) and Abstracts Views on Vision4Press platform.
Data correspond to usage on the plateform after 2015. The current usage metrics is available 48-96 hours after online publication and is updated daily on week days.
Initial download of the metrics may take a while.