Fig. C.1
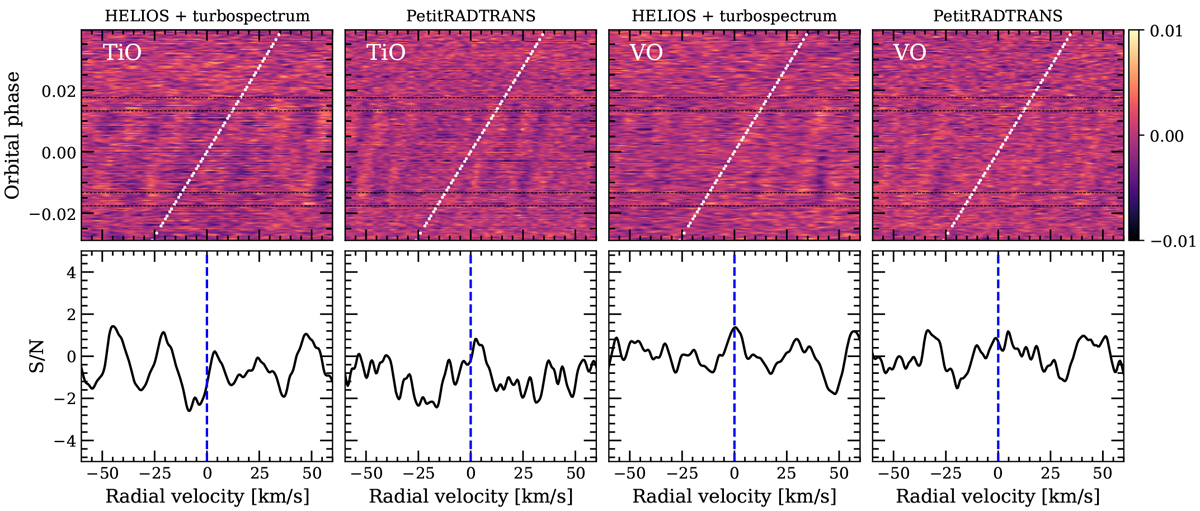
Cross-correlation results of both nights combined for TiO and VO, obtained assuming different atmospheric models (HELIOS+turbospectrum and PetitRADTRANS). Top panel: cross-correlation maps of the TiO (first and second columns) and VO (third and fourth columns). Bottom panel: average of the in-transit cross-correlation values in the planet rest frame between the first and fourth contacts. The vertical axis is shown in S/N units for a better visualisation of the features strength, computed as described in Sect. 4.2. Positive S/N means correlation (see CCF values in the colour bar).
Current usage metrics show cumulative count of Article Views (full-text article views including HTML views, PDF and ePub downloads, according to the available data) and Abstracts Views on Vision4Press platform.
Data correspond to usage on the plateform after 2015. The current usage metrics is available 48-96 hours after online publication and is updated daily on week days.
Initial download of the metrics may take a while.