Fig. B.1
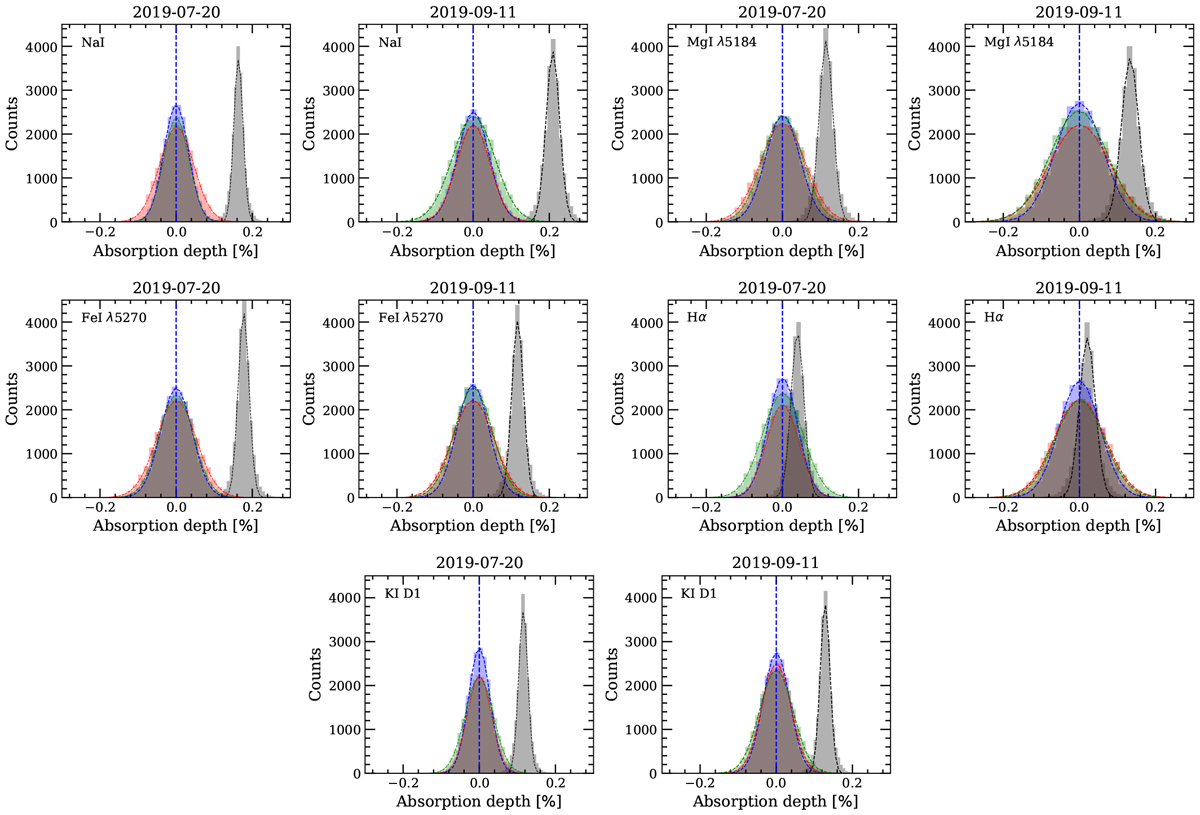
Distributions of the EMC analysis of each individual night for different spectral lines: Na I D1 and D2, Mg I λ5184, Fe I λ5270, Hα, and K I D1. The absorption depth calculations are performed using 0.4 Å bandwidth except for the Hα for which we use 0.5 Å. In green we present the ‘out-out’ scenario, in red the ‘in-in’, in blue the ‘mix-mix’, and in grey the ‘in-out’. The blue dashed vertical lines show the zero absorption level. In coloured dashed lines, we show the Gaussian fit to the histograms.
Current usage metrics show cumulative count of Article Views (full-text article views including HTML views, PDF and ePub downloads, according to the available data) and Abstracts Views on Vision4Press platform.
Data correspond to usage on the plateform after 2015. The current usage metrics is available 48-96 hours after online publication and is updated daily on week days.
Initial download of the metrics may take a while.