Fig. A.6
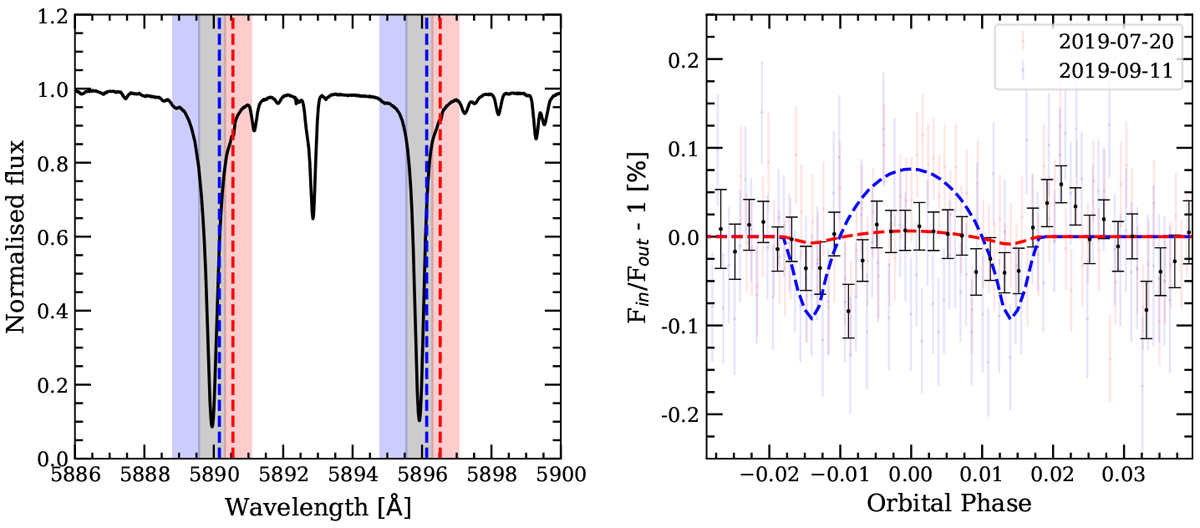
Transmission light curves around the Na I computed as presented in Snellen et al. (2008) and Albrecht et al. (2009). Left panel: stellar spectrum around the Na I showing the central (grey) and reference (blue and red) passbands of each line of the doublet, all of them with a bandwidth of 0.75 Å. The vertical dashed lines show the position of the telluric Na I absorption residuals for the night of 2019-07-20 (red) and 2019-09-11 (blue). Right panel: Na I transmission light curve of each night (in colours) and the combination of the two nights (black dots). The combined result is binned by 0.002 in orbital phase, similar to the results presented in the previous literature. The blue-dashed line corresponds to the modelled transmission light curve considering the RM and CLV effects in the stellar spectrum. The red-dashed line considers only the RM effect.
Current usage metrics show cumulative count of Article Views (full-text article views including HTML views, PDF and ePub downloads, according to the available data) and Abstracts Views on Vision4Press platform.
Data correspond to usage on the plateform after 2015. The current usage metrics is available 48-96 hours after online publication and is updated daily on week days.
Initial download of the metrics may take a while.