Fig. A.5
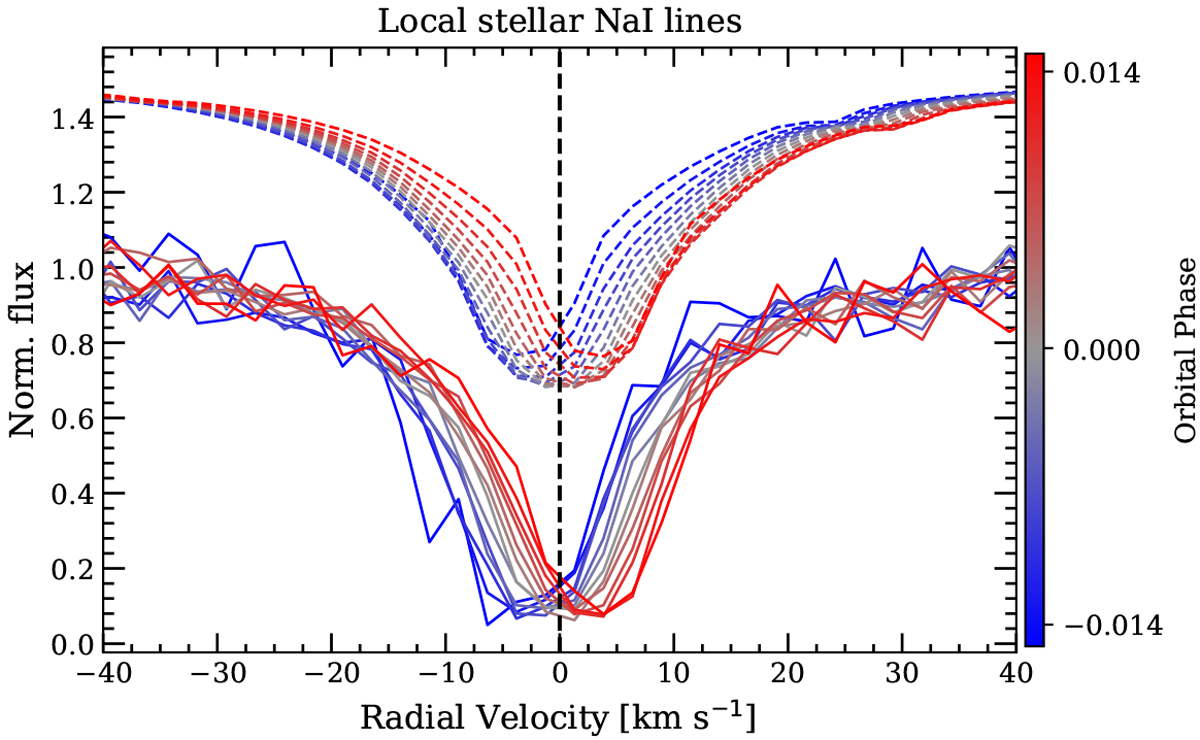
Observed (solid lines) and modelled (dashed lines) local stellar sodium Na I profiles at different orbital phases during the transit. The profiles are shown normalised to their continuum level, and result from the combination of both Na I D lines of the two nights of observation. The data areshown binned by 2.5 km s−1 and each profile is the result of combining the individual local stellar lines every 0.0025 in orbitalphase. The models are shown with an offset to the vertical axis for better visualisation, and are computed using the MARCS stellar models in LTE. The colours indicate the orbital phase of the planet (see colour bar). The vertical black-dashed line is the reference at 0 km s−1.
Current usage metrics show cumulative count of Article Views (full-text article views including HTML views, PDF and ePub downloads, according to the available data) and Abstracts Views on Vision4Press platform.
Data correspond to usage on the plateform after 2015. The current usage metrics is available 48-96 hours after online publication and is updated daily on week days.
Initial download of the metrics may take a while.