Fig. 11
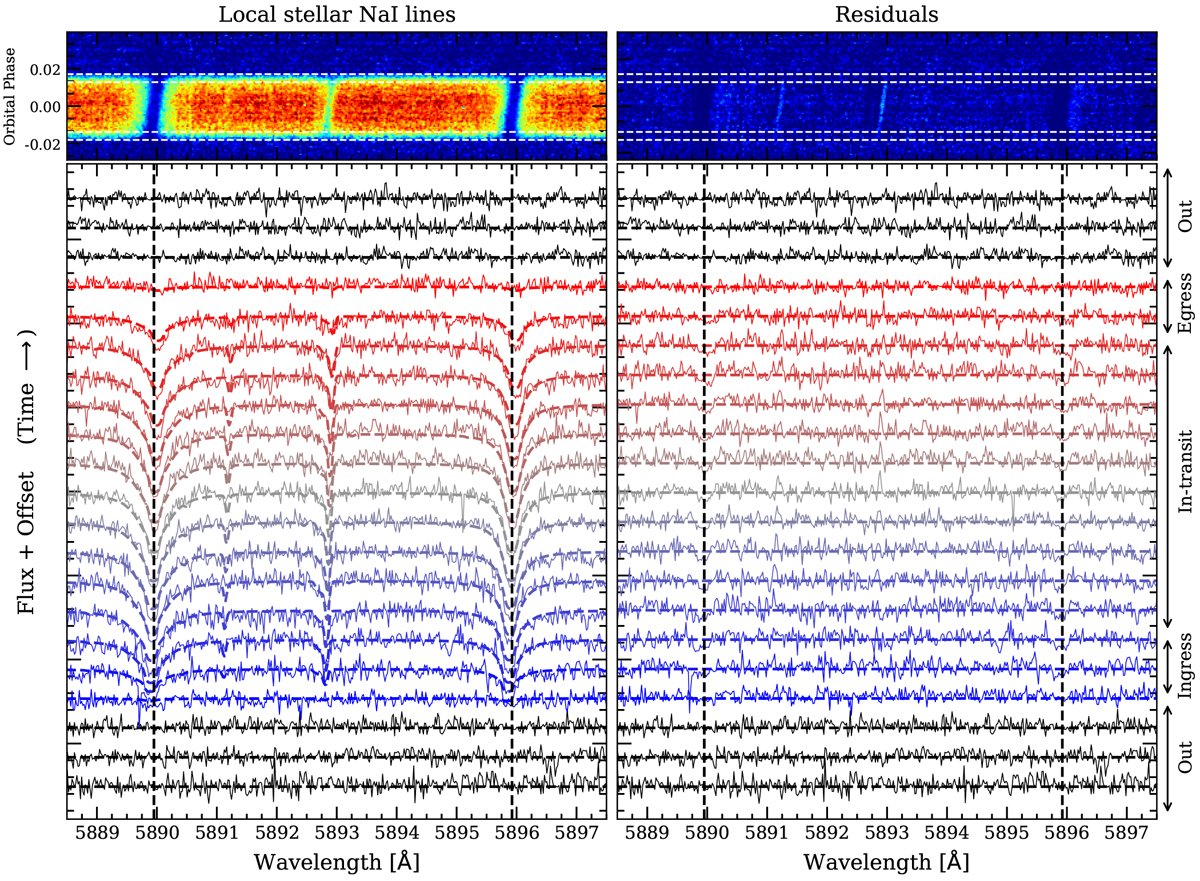
Left panel: local stellar spectrum of HD 209458 around the Na I doublet lines. Top-left panel: local stellar spectrum following the same format presented in Fig. 1, but around the Na I doublet. Bottom-left panel: time-evolution of the local stellar spectrum presented in the top panel but, in this case, the flux information is shown in the vertical axis. The spectra are not normalised to their own continuum level, so they still contain the flux information (the normalised profiles are shown in Fig. A.5). For a clear visualisation, we modified the continuum flux to include an offset so the spectra are shown ordered in orbital phase. The colours are indicative of the orbital phase of the planet and, therefore, the radial-velocity of the stellar disc surface. The observationsare shown with solid lines and the stellar models with dashed lines of the same colour. The stellar models are computed using MARCS in LTE. The out-of-transit results are shown in black. The spectra are shown binned by 0.02 Å and 0.0025 in orbital phase. The black-dashed vertical lines indicate the position of the Na I doublet lines. Right panel: residuals between the observed and modelled local spectra presented in the left panel.
Current usage metrics show cumulative count of Article Views (full-text article views including HTML views, PDF and ePub downloads, according to the available data) and Abstracts Views on Vision4Press platform.
Data correspond to usage on the plateform after 2015. The current usage metrics is available 48-96 hours after online publication and is updated daily on week days.
Initial download of the metrics may take a while.