Fig. 10
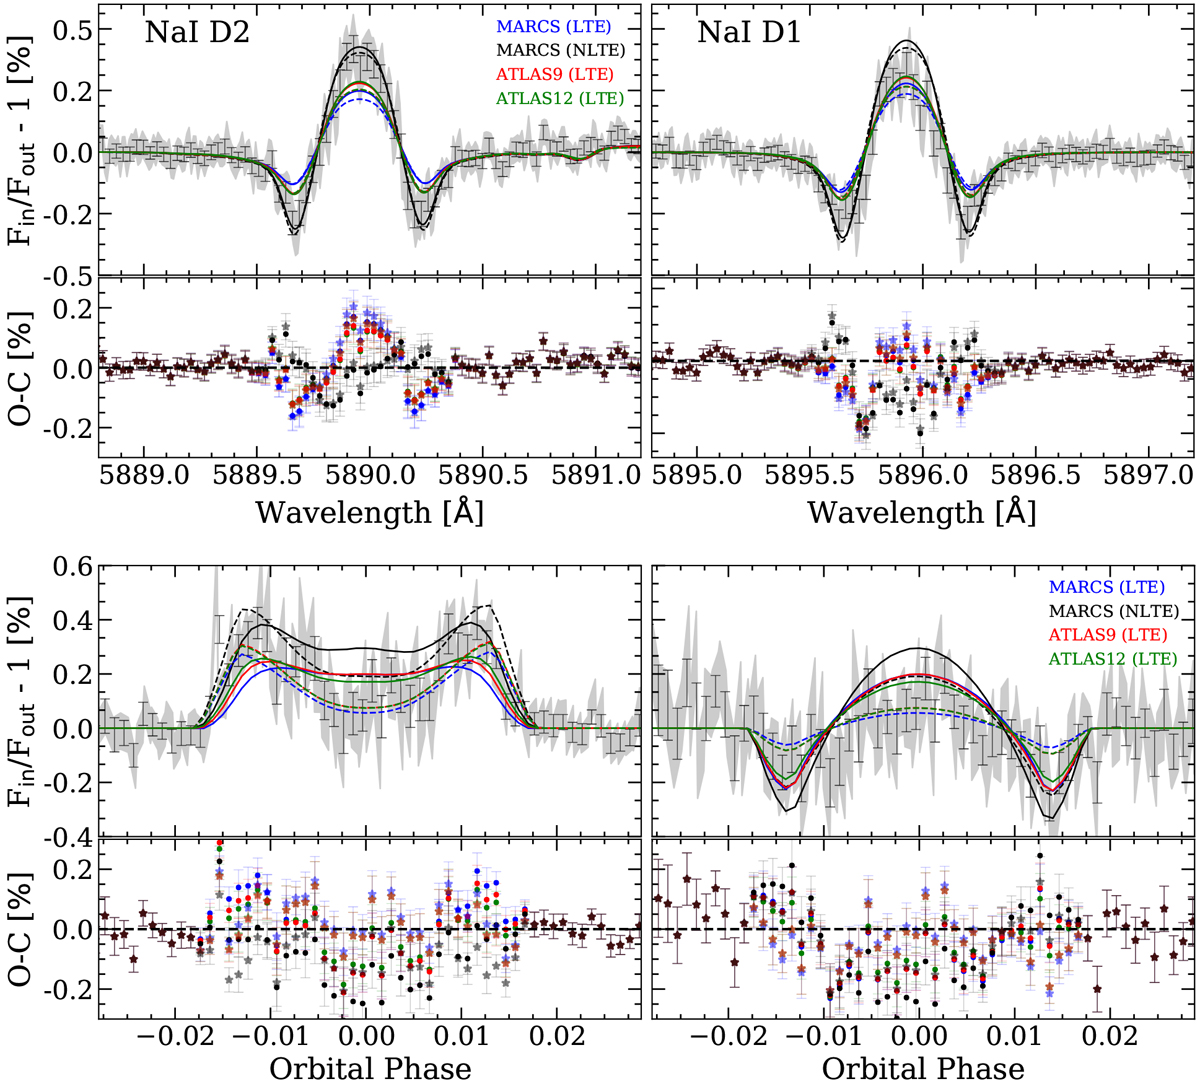
Toppanel, from left to right: modelled CLV and RM effects of the Na I doublet lines assuming different stellar atmospheric models compared with the transmission spectrum around Na I D2 (left panel) and D1 (right panel). Bottom panel: transmission light curve of both lines combined calculated in the planet rest frame(left panel) and the transmission light curve in the stellar rest frame (right panel). In solid lines, we show the models containing the CLV and RM deformation. In dashed lines, it is only the RM that is considered. In light-grey, we show the original data and in black error bars the data binned by 0.03 Å (top panels) and 0.001 in the orbital phase (bottom panels). The different stellar models are shown in different colours and indicated in the legends. Bottom row: residuals between the data and the models. The colours indicate the residuals between the data and the model shown with the same colour. We indicate the residuals with the models computed considering only the RM deformation with stars and the residuals with the models containing the CLV and RM deformation with dots.
Current usage metrics show cumulative count of Article Views (full-text article views including HTML views, PDF and ePub downloads, according to the available data) and Abstracts Views on Vision4Press platform.
Data correspond to usage on the plateform after 2015. The current usage metrics is available 48-96 hours after online publication and is updated daily on week days.
Initial download of the metrics may take a while.