Fig. 1
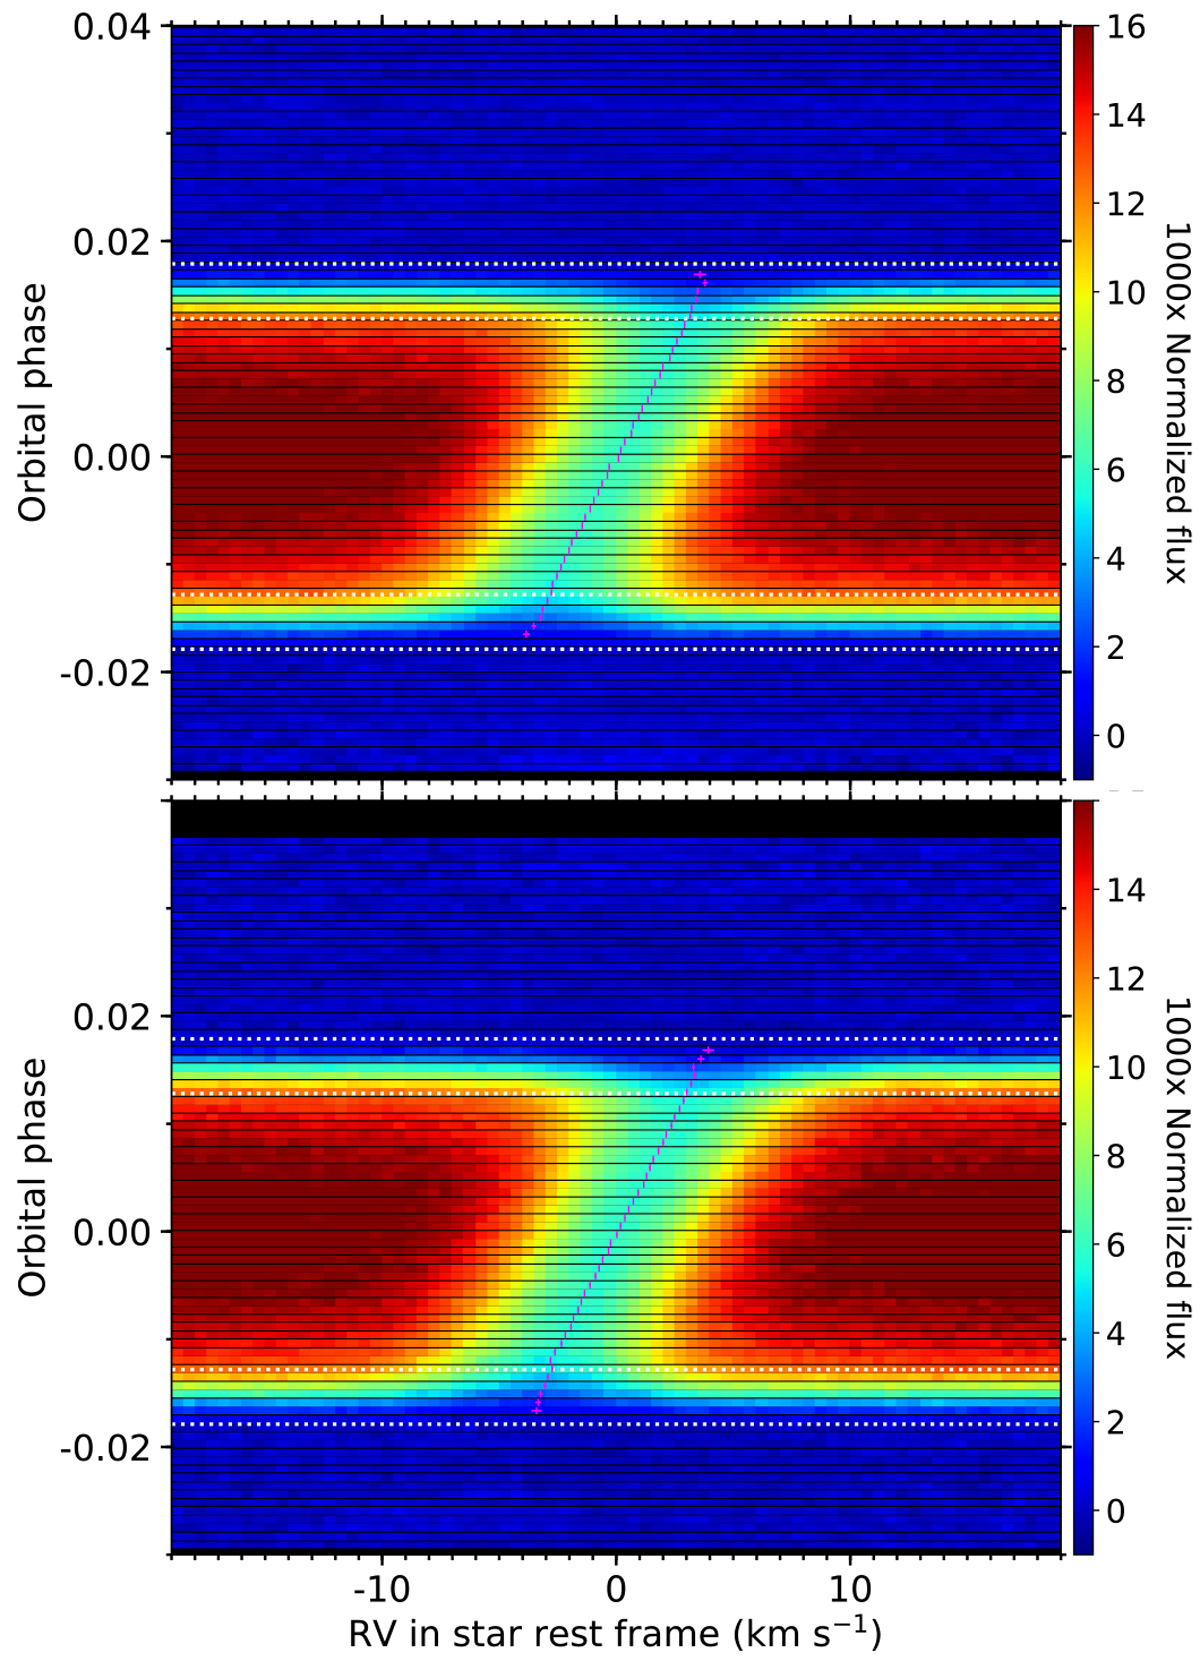
Map of the CCFloc series in the first (top panel) and second (bottom panel) night, as a function of orbital phase (in ordinate) and radial velocity in the stellar rest frame (in abscissa). Maps were obtained for the adjusted transit parameters (see text). Colours indicate the flux values. The four horizontal dashed white lines show the times of transit contacts. In-transit CCFloc show the average stellar line profiles from the regions occulted by HD 209458 b across the stellar disk. The magenta crosses are the measured centroids of the average stellar line profiles, corresponding to the local RVs of the planet-occulted regions.
Current usage metrics show cumulative count of Article Views (full-text article views including HTML views, PDF and ePub downloads, according to the available data) and Abstracts Views on Vision4Press platform.
Data correspond to usage on the plateform after 2015. The current usage metrics is available 48-96 hours after online publication and is updated daily on week days.
Initial download of the metrics may take a while.