| Issue |
A&A
Volume 647, March 2021
|
|
|---|---|---|
| Article Number | A38 | |
| Number of page(s) | 7 | |
| Section | Cosmology (including clusters of galaxies) | |
| DOI | https://doi.org/10.1051/0004-6361/202039502 | |
| Published online | 04 March 2021 | |
Testing late-time cosmic acceleration with uncorrelated baryon acoustic oscillation dataset⋆
1
Frankfurt Institute for Advanced Studies (FIAS), Ruth-Moufang-Strasse 1, 60438 Frankfurt am Main, Germany
2
DAMTP, Centre for Mathematical Sciences, University of Cambridge, Wilberforce Road, Cambridge CB3 0WA, UK
3
Physics Department, Ben-Gurion University of the Negev, Beer-Sheva 84105, Israel
e-mail: This email address is being protected from spambots. You need JavaScript enabled to view it.
4
Institute for Nuclear Research and Nuclear Energy, Bulgarian Academy of Sciences, Sofia, Bulgaria
Received:
23
September
2020
Accepted:
15
December
2020
Abstract
Baryon acoustic oscillations (BAO) involve measuring the spatial distribution of galaxies to determine the growth rate of cosmic structures. We derive constraints on cosmological parameters from 17 uncorrelated BAO measurements that were collected from 333 published data points in the effective redshift range 0.106 ≤ z ≤ 2.36. We test the correlation of the subset using a random covariance matrix. The Λ cold dark matter (ΛCDM) model fit yields the cosmological parameters Ωm = 0.261 ± 0.028 and ΩΛ = 0.733 ± 0.021. Combining the BAO data with the Cosmic Chronometers data, the Pantheon type Ia supernova, and the Hubble diagram of gamma-ray bursts and quasars, the Hubble constant yields 69.85 ± 1.27 km s−1 Mpc−1 and the sound horizon distance gives 146.1 ± 2.15 Mpc. Beyond the ΛCDM model we test ΩkCDM and wCDM. The spatial curvature is Ωk = −0.076 ± 0.012 and the dark energy equation of states is w = −0.989 ± 0.049. We perform the Akaike information criteria test to compare the three models, and see that ΛCDM scores best.
Key words: cosmological parameters / methods: data analysis / astronomical databases: miscellaneous
The python files with the dataset and the fit package can be found at https://github.com/benidav/BAO-2020.
© ESO 2021
1. Introduction
The standard model of cosmology, the Λ cold dark matter (ΛCDM) model, requires a dark energy (DE) component responsible for the observed late-time acceleration of the expansion rate. The tension between the values of the Hubble constant H0 obtained from the late universe measurements (Riess et al. 2019) and those from the cosmic microwave background (CMB) by Planck Collaboration VI (2020) is larger than 4σ. This tension is one of the biggest challenges in modern cosmology (Di Valentino et al. 2020a,b,c; Efstathiou 2020; Borhanian et al. 2020; Hryczuk & Jodłowski 2020; Klypin et al. 2020; Ivanov et al. 2020; Chudaykin et al. 2020; Lyu et al. 2021; Alestas et al. 2020; Motloch & Hu 2020; Frusciante et al. 2020).
The measurement of the expansion history of the Universe at low redshifts provides observational tests for the dark energy while counting on different types of astrophysical objects and observational techniques. The use of type Ia supernovae (SNe) as standard candles originally established the accelerated expansion and solidified the introduction of the DE (Perlmutter et al. 1999; Riess et al. 1998). Baryon acoustic oscillations (BAO) provide a standard ruler that has been evolving with the Universe since the recombination epoch (Cuceu et al. 2019; Wu et al. 2020). The BAO scale at different times is a powerful tool for constraining the cosmological parameters. BAO are present in the distribution of matter, and any tracer of the large-scale structures can be used to measure the BAO peak. Current surveys include measurements at different redshifts using the clustering of galaxies, for example emission-line galaxies (ELGs), luminous red galaxies (LRGs), and quasars, from the correlation function of the Lyman-alpha (Lyα) absorption lines in the spectra of distant quasars, in cross-correlation with quasar positions and galaxies, in Fourier and configuration space. Their biggest advantage is the ability to study the cosmic acceleration independently from the Supernova and the CMB surveys, and thus to give a possible answer to the different observed tensions. This has been done already with different datasets (Handley 2021; Di Valentino et al. 2021a; Luo et al. 2020).
In this article we select 17 uncorrelated BAO points from the largest collection of BAO data points (333 points). The complete collection of BAO data (333 data points) would lead to a very large error due to data correlations. Therefore, we select a smaller dataset which may reduce the errors. We test the stability of this set against the inclusion of random correlations and then we perform standard analysis on the cosmological parameters.
The paper is structured as follows. Section 2 describes the theoretical background. Section 3 describes the methodology with the cross-correlation validation. Section 4 discusses the ΛCDM fit and Sect. 5 discusses on the extensions. Finally, Sect. 6 summarizes our results.
2. Theoretical background
We assume a Friedmann-Lemaître-Robertson-Walker metric with the scale parameter a = 1/(1 + z), where z is the redshift. The Friedmann equation for ΛCDM background reads
 (1)
(1)
where Ωr, Ωm, ΩΛ, and Ωk are respectively the fractional densities of radiation, matter, dark energy, and the spatial curvature at redshift z = 0. The function E(z) is the ratio H(z)/H0, where H(z) = ȧ/a is the Hubble parameter at redshift z and H0 is the Hubble parameter today. The radiation density can be computed as Ωr = 1 − Ωm − ΩΛ − Ωk. In the late universe, at the redshifts probed by BAO, the radiation fraction is very small, while for a flat Universe Ωk = 0. For wCDM the Friedmann equation is generalized to  .
.
The observed tracer redshifts and angles on the sky need to be converted to distances by adopting a fiducial cosmological model, and the analysis measures the ratio of the observed BAO scale to that predicted in the fiducial model.
Studies of the BAO feature in the transverse direction provide a measurement of DH(z)/rd = c/H(z)rd, with the comoving angular diameter distance (Hogg et al. 2020; Martinelli et al. 2020)
 (2)
(2)
where
 (3)
(3)
In our database we also use the angular diameter distance DA = DM/(1 + z) and the DV(z)/rd, which is a combination of the BAO peak coordinates above:
![Mathematical equation: $$ \begin{aligned} D_{\rm V}(z) \equiv [z D_{\rm H}(z) D_{\rm M}^2(z)]^{1/3}. \end{aligned} $$](/articles/aa/full_html/2021/03/aa39502-20/aa39502-20-eq5.gif) (4)
(4)
Here rd is the sound horizon at the drag epoch, and it is discussed below. Finally for very precise line-of-sight (or radial) observations, BAO can also measure directly the Hubble parameter (Benitez et al. 2009).
3. Methodology
The dataset we use includes a broad collection of points. The main contribution to our dataset comes from the different data releases (DRs) of the Sloan Digital Sky Survey (SDSS): (Seo et al. 2012; Anderson et al. 2013, 2014a,b; Moresco et al. 2016; Delubac et al. 2015; Gil-Marín et al. 2016a,b, 2017, 2018, 2020; Chuang et al. 2016, 2017; Wang et al. 2017, 2018a,b, 2020; Zhao et al. 2017, 2019, 2020; Vargas-Magaña et al. 2018; Cuesta et al. 2016; Beutler et al. 2017; Carvalho et al. 2016; de Carvalho et al. 2018; Icaza-Lizaola et al. 2020; Bautista et al. 2017, 2018, 2021; Zhang et al. 2014; Chuang & Wang 2013; Oka et al. 2014; Gaztanaga et al. 2009; Tojeiro et al. 2014; Alam et al. 2017; Ross et al. 2015; Percival et al. 2010; Ata et al. 2018; Tamone et al. 2020; de Mattia et al. 2021; Zhu et al. 2018; Nadathur et al. 2020; Raichoor et al. 2021; Hou et al. 2021; Neveux et al. 2020; Busca et al. 2013; du Mas des Bourboux et al. 2017, 2020; de Sainte Agathe et al. 2019; Blomqvist et al. 2019; Font-Ribera et al. 2014). To these data points we add the results from the WiggleZ Dark Energy Survey (Blake et al. 2012; Kazin et al. 2014), the Dark Energy Survey (DES; Abbott et al. 2019), and the Dark Energy Camera Legacy Survey (DECaLS; Sridhar et al. 2020) (LRG). Furthermore, we use data from the 6dF Galaxy Survey (6dFGS; Beutler et al. 2011; Carter et al. 2018). We also used some earlier tables of BAO data to improve our datasets (Kang et al. 2020; Akarsu et al. 2019; Nesseris et al. 2020; Zhang & Huang 2021; Benisty 2020). As a whole we gathered 333 BAO points including both the angular distances DH, DM, DA, and DV and the Hubble parameters multiplied by rd or rd/rd, fid, where rd, fid is the fiducial sound horizon.
The big collection of data points is highly correlated. Therefore, from this dataset we select an uncorrelated subsample on which we perform our analysis. The final dataset we use is a set of uncorrelated data points from different BAO measurements from Beutler et al. (2011), Ross et al. (2015), Percival et al. (2010), Tojeiro et al. (2014), Blake et al. (2012), Seo et al. (2012), Anderson et al. (2013), Sridhar et al. (2020), Bautista et al. (2018), Abbott et al. (2019), Hou et al. (2021), Ata et al. (2018), Busca et al. (2013), de Sainte Agathe et al. (2019). The collection is summarized in Table 1.
Uncorrelated dataset used in this paper.
A significant problem for the BAO dataset is the possible correlation between the different measurements in the diverse data releases. To evaluate the systematic error, one usually uses mocks based on N-body simulations with known cosmology that produce the appropriate covariance matrices. Since we use a sample of different experiments, we do not use the exact covariance matrix between them, which is not known. Instead, we perform covariance analysis based on the one proposed in Kazantzidis & Perivolaropoulos (2018). The covariance matrix for uncorrelated points is
 (5)
(5)
To mock the effect of possible correlations among data points, one can introduce a number of randomly selected nondiagonal elements in the covariance matrix while keeping it symmetric. With this approach we introduce positive correlations in up to six pairs of randomly selected data points (more than 25% of the data). The positions of the nondiagonal elements are chosen randomly and the magnitude of these randomly selected covariance matrix element Cij is set to
 (6)
(6)
where σiσj are the published 1σ errors of the data points i, j.
We use a nested sampler as implemented within the open-source package Polychord (Handley et al. 2015) with the GetDist package (Lewis 2019) to present the results. The prior we choose is with a uniform distribution, where Ωm ∈ [0.; 1.], ΩΛ ∈ [0.; 1 − Ωm], H0 ∈ [50; 100], and rd ∈ [100; 200] Mpc. The measurement of the Hubble constant yielding H0 = 74.03 ± 1.42 (km s−1) Mpc−1 at 68% confidence level (CL) by Riess et al. (2019) has been incorporated into our analysis as an additional prior, which we denote as R19. We note that the prior for rd is rather wide since the very narrow prior for rd has an effect of specifying the Hubble parameter (Knox & Millea 2020), which we tried to avoid in our analysis. With respect to the fiducial cosmology, we use as a prior for the ratio rd/rd, fid ∈ [0.9, 1.1].
The results for the BAO and the BAO + R19 can be seen in Fig. 1 and in Table 2. Including the correlations changes the results, as expected, but it does not lead to a significant difference. The difference between no correlation and 30% correlated points is about 10%, which is similar to the difference in Kazantzidis & Perivolaropoulos (2018), but in our case rd and the fiducial cosmology are free parameters. Thus, we consider that even though this approach may underestimate the covariance matrices, it gives us a justification to consider the points uncorrelated.
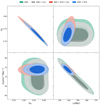 |
Fig. 1. Posterior distribution for ΛCDM with and without a test random covariance matrix with six components. The distribution with covariance matrix gives a slightly bigger error bar, but still very similar to the uncorrelated dataset. |
Variation in the derived parameters depending on the number of correlated points n.
In order to constrain the cosmological models, in addition to the BAO dataset we use cosmic chronometers (CCs) and standard candles (SCs). The CCs exploit the evolution of differential ages of passive galaxies at different redshifts to directly constrain the Hubble parameter (Jimenez & Loeb 2002; Stern et al. 2010; Moresco et al. 2012a; Ratsimbazafy et al. 2017; Moresco 2015; Pellejero-Ibanez et al. 2017). The set includes 30 uncorrelated CC measurements of H(z), as discussed in Moresco et al. (2012a,b, 2016), Moresco (2015). For the SCs we use uncorrelated measurements of the Pantheon type Ia supernova dataset (Scolnic et al. 2018) that were collected in Anagnostopoulos et al. (2020) and the measurements from quasars (Roberts et al. 2017) and gamma-ray bursts (Demianski et al. 2017). Below, we refer to the dataset including BAO, CCs, and SCs as the “full” dataset.
4. Standard model
In this model we vary five parameters: {H0, Ωm, ΩΛ, rd, rd/rd, fid}. In Fig. 2 we report the 68% and 95% confidence levels for the posterior distribution of some of the parameters of the standard ΛCDM model. The numerical values are reported in Table 3. When the fit combines the CC sample and the BAO, the predicted values are constrained dramatically and give values closer to that announced by Planck Collaboration VI (2020). When we add the Riess 2019 prior for H0, the fit gives a result much closer to the observed in the supernovae sample (Riess et al. 2019). We note that the matter energy density is smaller than the value reported by Planck ( ), but this has been seen in other studies as well (Nunes & Bernui 2020; Nunes et al. 2020).
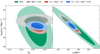 |
Fig. 2. Posterior distribution for different measurements with the ΛCDM model with 1σ and 2σ. The BAO refers to the baryon acoustic oscillations dataset from Table 1. The CC dataset refers to cosmic chronometers and SC refers to the Hubble diagram from type Ia supernova, quasars and gamma ray bursts. R19 denotes the Riess 2019 measurement of the Hubble constant as a Gaussian prior. |
Constraints at 95% CL errors on the cosmological parameters for the ΛCDM, ΩkΛCDM, and wCDM models.
The BAO scale is set by the sound horizon at the drag epoch zd when photons and baryons decouple, given by
 (7)
(7)
where cs ≈ c(3+9ρb/(4ργ))−0.5 is the speed of sound in the baryon-photon fluid with the baryon ρb(z) and the photon ργ(z) densities, respectively (Aubourg et al. 2015). The drag epoch corresponds to the time when the baryons decouple from the photons at zd ≈ 1060. For a flat ΛCDM, the Planck measurements yield rd = 147.09 ± 0.26 Mpc and the WMAP fit gives 152.99 ± 0.97 Mpc (Planck Collaboration VI 2020). From large-scale structure combined with CC, SNe and 150.0 ± 1.89 Mpc, and with the local H0 measurement rd = 143.9 ± 3.1 Mpc (Planck Collaboration VI 2020). Final measurements from the completed SDSS lineage of experiments in large-scale structure provide rd = 149.3 ± 2.8 Mpc (Alam et al. 2020). Using BAO, SNea, the ages of early-type galaxies, and local determinations of the Hubble constant, Verde et al. (2017) reports rd = 143.9 ± 3.1 Mpc. Nunes & Bernui (2020) and Nunes et al. (2020) give similar values:  Mpc from rd/DM + BBN + H0LiCOW,
  Mpc from rd/DM + BBN + CC. We see that there is a big discrepancy between results from the early universe and those from the late one, similar to the H0 tension. Due to this, Knox & Millea (2020) refers to it as “tensions in the rd − H0 plane”.
The posterior distribution of the rd versus the Hubble parameter is presented in Fig. 2. The fit for BAO + R19 yields 139.0 ± 3.1 Mpc. Adding the CC and the SC gives 146.1 ± 2.2 Mpc and taking all the datasets plus the Riess prior leads to rd = 143.5 ± 2.0 Mpc. It is important to note that here the results depend critically on the prior for rd and H0 as wider or narrower priors would move the preferred values in the rd − H0 plane. We see that only when working with a uniform prior are our results close to the Planck results and to the SDSS results, and also to the results of earlier works taking into account only BAO data points (Zhang & Huang 2021).
5. Extensions
We examine two types of extensions of the standard ΛCDM model: the ΩkΛCDM model and the wCDM model. For the ΩkCDM, we use as priors Ωk ∈ [ − 0.1; 0.1] and Ωm ∈ [0.1; 1 − ΩΛ], while for the wCDM we use w ∈ [ − 1.25; − 0.75]. All the other priors are the same as for ΛCDM. These results can be seen in Fig. 3, and the values can be found in Table 3.
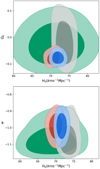 |
Fig. 3. Posterior distribution for wCDM and ΩkΛCDM. Upper panel: Ωk vs. the H0 contour, lower panel: w vs. the H0 contour. The legend is the same as in Fig. 2. |
ΩkΛCDM. For all three samples we get a negative spatial curvature energy density (Ωk < 0), which corresponds to k = 1 (i.e., a closed universe). This is in line with previous results obtained by Planck Collaboration VI (2020) for CMB alone which found a preference for a closed universe at 3.4σ and also with those obtained by Li et al. (2020), which includes the data from the CC, Pantheon, and BAO measurements, which leads to the conclusion that negative Ωk also relieves the H0 tension. Under the priors we use and with the full dataset, we do not observe the described tension between Planck and BAO data (Di Valentino et al. 2019). The numbers are very close to zero so they do not exclude a flat universe. From Fig. 3 is clear that the data from BAO alone has a very slight preference for a closed universe, but with a big error. A smaller prior, for example Ωk ∈ ( − 0.05, 0.05), does not change the preference for a closed universe.
It should be noted that the value of Ωm in Table 3 in the BAO + R19 case is small compared to the other cases and to the result obtained by Planck 2018: (Ωm, H0, Ωk) = (0.349, 63.6, − 0.011) (Planck Collaboration VI 2020). We attribute this to the wider prior we use for Ωk ∈ [ − 0.1, 0.1]. If a tighter prior is used, for example Ωk ∈ [ − 0.01, 0.01], we get Ωm = 0.212 ± 0.026, ΩΛ = 0.776 ± 0.025, Ωk = −0.009 ± 0.00008 and H0 = 73.78 ± 1.27 with rd = 141.5 ± 2.9. While this result is closer to the Planck results, we consider that using such a tight prior forces the model towards a flat universe. Similar results for a wider prior can be seen in Di Valentino et al. (2021b), where the matter density also fluctuates in a big interval Ωm ∈ (0.084…0.48). Once again, we can explain these fluctuations with the nontrivial connection between H0, rd, and Ωm. Explicitly, increasing Ωm leads to a smaller rd, which also affects the value of H0. Comparing the results for the two priors of Ωk we see that they are consistent with Fig. 1 in Knox & Millea (2020).
The wCDM model. The dark energy equation of state we obtain differs from the one obtained by Planck Collaboration VI (2020) which gives w = −1.03 ± 0.03 (i.e., it is essentially consistent with a cosmological constant). In our case, it is much closer to the analysis done in Di Valentino et al. (2021a) and Vagnozzi et al. (2021, 2020), but adding the full dataset of different astrophysical objects does not exclude w = −1. The BAO + R19 dataset seems to tend to w < −1, while the full dataset seem to tend to w ≥ −1. The BAO + R19 data is sensitive to the choice of prior so that in the case w ∈ ( − 1.5, − 0.5), we get w = −1.22. This sensitivity does not apply to the full dataset for which the results are stable with respect to the choice of a prior.
In conclusion, testing the extended models with the chosen dataset and under the wide priors we use seems to be very inconclusive, and does not allow us to rule out ΛCDM as the default model.
6. Discussion
This work selects 17 uncorrelated BAO points from the largest collection of BAO data points (333 points), in order to decrease the intrinsic error in the posterior distribution due to possible correlations between measurements. We perform a procedure that mocks adding random correlations to the covariance matrix, and then we verify that indeed these additions do not change the resulting cosmological parameters significantly.
In addition to the suggested dataset we use uncorrelated points from different datasets: the CCs (30 points), and the type Ia supernova (40 selected points), points from the Hubble diagram for quasars (24 points), and gamma-ray bursts (162 points). Although the tension exists it has been alleviated: 2σ for the H0. Therefore, while our results suggest that cosmic acceleration can be deduced only from late-time measurements, the tension with the Planck values suggests a possibility for new physics (Pogosian et al. 2020; Sekiguchi & Takahashi 2020; Di Valentino et al. 2020d,e,f; Ye & Piao 2020; Yang et al. 2020; Benisty & Guendelman 2020; Benisty et al. 2019, 2020; Staicova & Stoilov 2016; Ben-Dayan 2019; Ben-Dayan et al. 2014; Vasak et al. 2020; Bengaly et al. 2020; Alexander et al. 2019a,b; Khosravi et al. 2019; Zwane et al. 2018; Narimani et al. 2014; Afshordi et al. 2009; Kazantzidis et al. 2019; Kazantzidis & Perivolaropoulos 2019).
The results depend critically on the priors for rd and H0. From our numerical experiments, it is clear that using a tighter prior for rd will also move H0 to a value compatible with that rd (i.e., it will move it into the rd − H0 plane). This means that the effect from the choice of a prior for rd may be as strong as using a tight prior such as R19 on H0. On the other hand, the tight prior on H0 combined with a large interval for rd essentially swings the results towards the H0 measurement on which the prior is centered. We see that only when working with a uniform prior are our results close to those obtained by Planck and the SDSS experiments: in this case our priors impose the least assumptions on the model.
The dependence on the priors is strongest in the ΩkCDM model, which yields Ωm = 0.181 ± 0.051 for the BAO + R19 for a wider prior, and Ωm = 0.212 ± 0.026 for the same dataset with a tighter prior for Ωk. The Hubble parameter H0 in both cases remains similar (due to the tight prior), while rd changes as explained above. The curvature energy density remains small but negative (i.e., the preference for a closed universe does not depend on the priors we tested).
To compare both the ΩkCDM and the wCDM models to ΛCDM we take into account that ΛCDM is a nested model to both of the suggested extension, with 1 degree of freedom difference, on which we can use standard statistical tests. We calculate them for the total dataset without the Riess prior. For this we can define the reduced chi-square statistic,  , where d.o.f. is the degrees of freedom of the model and χ2 is the weighted sum of squared deviations. Under the same number of runs for the three models, it is close to 1 (χ2/d.o.f.ΛCDM, χ2/d.o.f.w, χ2/d.o.f.Ωk ∼ {0.949, 0.989, 0.974}. The Akaike information criteria (AIC; Burnham & Anderson 2004; Liddle 2007; Anagnostopoulos et al. 2019) for a large number of data points (in our case N = 273) can be defined as
 (8)
(8)
where p is the number of parameters of the model. Then we can calculate the AIC for the main model and its extensions. We find for ΛCDM, wCDM, and ΩkCDM, respectively, AIC = {264.5, 266.8, 272.1}. Since ΛCDM has the least AIC, we obtain that ΛCDM has the best fit. The difference between ΛCDM and the two extensions are 2.3 and 7.6 AIC units, respectively. This suggests that, according to our calculations, there is some support in favor of wCDM and weak support in favor of ΩkCDM (Arevalo et al. 2017).
Finally, comparing our results with the eBoss Collaboration official results (Alam et al. 2020) we see that our results are consistent with them, even though we use a different combination of uncorrelated points for our analysis. Interestingly, we see that in our case w ≥ −1 for the full dataset, which differs from the estimations in some of the different cases considered in Alam et al. (2020). Our dataset differs from theirs by the inclusion of the quasars and the GRB data and the exclusion of Planck points. In conclusion, the BAO collection offered here is a powerful tool for studying the cosmological parameters when combined with other estimations for the Hubble constant.
Acknowledgments
We thank to Adam Riess, Eduardo Guendelman, Sunny Vagnozzy, Eleonora Di Valentino and Horst Stocker for fruitful discussions. We would also like to thank the anonymous referee for their helpful comments regarding the manuscript. D.B. gratefully acknowledge the support from Frankfurt Institute for Advanced Studies (FIAS) as well the to support from Ben-Gurion University in Beer-Sheva, Israel. D.S. is thankful to Bulgarian National Science Fund for support via research grants DN-18/1 and DN-08/17 and KP-06-N38/11. We have received partial support from European COST actions CA15117 and CA18108.
References
- Abbott, T. M. C., Abdalla, F. B., Alarcon, A., et al. 2019, MNRAS, 483, 4866 [Google Scholar]
- Afshordi, N., Geshnizjani, G., & Khoury, J. 2009, JCAP, 0908, 030 [NASA ADS] [CrossRef] [Google Scholar]
- Akarsu, O., Kumar, S., Sharma, S., & Tedesco, L. 2019, Phys. Rev. D, 100, 023532 [Google Scholar]
- Alam, S., Ata, M., Bailey, S., et al. 2017, MNRAS, 470, 2617 [NASA ADS] [CrossRef] [Google Scholar]
- Alam, S., Aubert, M., Avila, S., et al. 2020, ArXiv e-prints [arXiv:2007.08991] [Google Scholar]
- Alestas, G., Kazantzidis, L., & Perivolaropoulos, L. 2020, Phys. Rev. D, 101, 123516 [Google Scholar]
- Alexander, S., Cortês, M., Liddle, A. R., et al. 2019a, Phys. Rev. D, 100, 083507 [Google Scholar]
- Alexander, S., Cortês, M., Liddle, A. R., et al. 2019b, Phys. Rev. D, 100, 083506 [Google Scholar]
- Anagnostopoulos, F. K., Basilakos, S., & Saridakis, E. N. 2019, Phys. Rev. D, 100, 083517 [Google Scholar]
- Anagnostopoulos, F. K., Basilakos, S., & Saridakis, E. N. 2020, Eur. Phys. J. C, 80, 826 [Google Scholar]
- Anderson, L., Aubourg, E., Bailey, S., et al. 2013, MNRAS, 427, 3435 [Google Scholar]
- Anderson, L., Aubourg, E., Bailey, S., et al. 2014a, MNRAS, 439, 83 [Google Scholar]
- Anderson, L., Aubourg, E., Bailey, S., et al. 2014b, MNRAS, 441, 24 [Google Scholar]
- Arevalo, F., Cid, A., & Moya, J. 2017, Eur. Phys. J. C, 77, 565 [Google Scholar]
- Ata, M., Baumgarten, F., Bautista, J., et al. 2018, MNRAS, 473, 4773 [Google Scholar]
- Aubourg, E., Bailey, S., Bautista, J. E., et al. 2015, Phys. Rev. D, 92, 123516 [Google Scholar]
- Bautista, J. E., Busca, N. G., Guy, J., et al. 2017, A&A, 603, A12 [NASA ADS] [CrossRef] [EDP Sciences] [Google Scholar]
- Bautista, J. E., Vargas-Magaña, M., Dawson, K. S., et al. 2018, ApJ, 863, 110 [Google Scholar]
- Bautista, J. E., Paviot, R., Vargas-Magaña, M., et al. 2021, MNRAS, 500, 736 [Google Scholar]
- Ben-Dayan, I. 2019, Phys. Rev. D, 99, 096006 [Google Scholar]
- Ben-Dayan, I., Durrer, R., Marozzi, G., & Schwarz, D. J. 2014, Phys. Rev. Lett., 112, 221301 [Google Scholar]
- Bengaly, C. A. P., Clarkson, C., Kunz, M., & Maartens, R. 2020, ArXiv e-prints [arXiv:2007.04879] [Google Scholar]
- Benisty, D. 2020, Phys. Dark Univ., 1, 100766 [Google Scholar]
- Benisty, D., & Guendelman, E. I. 2020, Int. J. Mod. Phys. D, 10, 1142 [Google Scholar]
- Benisty, D., Guendelman, E. I., Saridakis, E. N., et al. 2019, Phys. Rev. D, 100, 043523 [Google Scholar]
- Benisty, D., Guendelman, E. I., Nissimov, E., & Pacheva, S. 2020, Int. J. Mod. Phys. D, 26, 2050104 [Google Scholar]
- Benitez, N., Gaztanaga, E., Miquel, R., et al. 2009, ApJ, 691, 241 [Google Scholar]
- Beutler, F., Blake, C., Colless, M., et al. 2011, MNRAS, 416, 3017 [Google Scholar]
- Beutler, F., Seo, H.-J., Ross, A. J., et al. 2017, MNRAS, 464, 3409 [Google Scholar]
- Blake, C., Brough, S., Colless, M., et al. 2012, MNRAS, 425, 405 [NASA ADS] [CrossRef] [Google Scholar]
- Blomqvist, M., du Mas des Bourboux, H., Busca, N. G., et al. 2019, A&A, 629, A86 [NASA ADS] [CrossRef] [EDP Sciences] [Google Scholar]
- Borhanian, S., Dhani, A., Gupta, A., Arun, K. G., & Sathyaprakash, B. S. 2020, ApJ, 905, L28 [Google Scholar]
- Burnham, K. P., & Anderson, D. R. 2004, Soc. Meth. Res., 33, 261 [Google Scholar]
- Busca, N. G., Delubac, T., Rich, J., et al. 2013, A&A, 552, A96 [NASA ADS] [CrossRef] [EDP Sciences] [Google Scholar]
- Carter, P., Beutler, F., Percival, W. J., et al. 2018, MNRAS, 481, 2371 [Google Scholar]
- Carvalho, G. C., Bernui, A., Benetti, M., Carvalho, J. C., & Alcaniz, J. S. 2016, Phys. Rev. D, 93, 023530 [Google Scholar]
- Chuang, C.-H., & Wang, Y. 2013, MNRAS, 435, 255 [Google Scholar]
- Chuang, C.-H., Prada, F., Pellejero-Ibanez, M., et al. 2016, MNRAS, 461, 3781 [Google Scholar]
- Chuang, C.-H., Pellejero-Ibanez, M., Rodríguez-Torres, S., et al. 2017, MNRAS, 471, 2370 [Google Scholar]
- Chudaykin, A., Gorbunov, D., & Nedelko, N. 2020, JCAP, 2008, 013 [Google Scholar]
- Cuceu, A., Farr, J., Lemos, P., & Font-Ribera, A. 2019, JCAP, 10, 044 [Google Scholar]
- Cuesta, A. J., Vargas-Magaña, M., Beutler, F., et al. 2016, MNRAS, 457, 1770 [Google Scholar]
- de Carvalho, E., Bernui, A., Carvalho, G. C., Novaes, C. P., & Xavier, H. S. 2018, JCAP, 1804, 064 [Google Scholar]
- Delubac, T., Bautista, J. E., Busca, N. G., et al. 2015, A&A, 574, A59 [NASA ADS] [CrossRef] [EDP Sciences] [Google Scholar]
- de Mattia, A., Ruhlmann-Kleider, V., Raichoor, A., et al. 2021, MNRAS, 501, 5616 [Google Scholar]
- Demianski, M., Piedipalumbo, E., Sawant, D., & Amati, L. 2017, A&A, 598, A112 [NASA ADS] [CrossRef] [EDP Sciences] [Google Scholar]
- de Sainte Agathe, V., Balland, C., du Mas des Bourboux, H., et al. 2019, A&A, 629, A85 [NASA ADS] [CrossRef] [EDP Sciences] [Google Scholar]
- Di Valentino, E., Melchiorri, A., & Silk, J. 2019, Nat. Astron., 4, 196 [Google Scholar]
- Di Valentino, E., Anchordoqui, L. A., Akarsu, O., et al. 2020a, ArXiv e-prints [arXiv:2008.11283] [Google Scholar]
- Di Valentino, E., Anchordoqui, L. A., Akarsu, O., et al. 2020b, ArXiv e-prints [arXiv:2008.11284] [Google Scholar]
- Di Valentino, E., Anchordoqui, L. A., Akarsu, O., et al. 2020c, ArXiv e-prints [arXiv:2008.11285] [Google Scholar]
- Di Valentino, E., Melchiorri, A., Mena, O., & Vagnozzi, S. 2020d, Phys. Rev. D, 101, 063502 [Google Scholar]
- Di Valentino, E., Melchiorri, A., Mena, O., & Vagnozzi, S. 2020e, Phys. Dark Univ., 30, 100666 [Google Scholar]
- Di Valentino, E., Linder, E. V., & Melchiorri, A. 2020f, Phys. Dark Univ., 30, 100733 [Google Scholar]
- Di Valentino, E., Melchiorri, A., & Silk, J. 2021a, ApJ, 908, L9 [Google Scholar]
- Di Valentino, E., Melchiorri, A., Mena, O., Pan, S., & Yang, W. 2021b, MNRAS, 502, L23 [Google Scholar]
- du Mas des Bourboux, H., Le Goff, J. M., Blomqvist, M., et al. 2017, A&A, 608, A130 [NASA ADS] [CrossRef] [EDP Sciences] [Google Scholar]
- du Mas des Bourboux, H., Rich, J., Font-Ribera, A., et al. 2020, ApJ, 901, 153 [Google Scholar]
- Efstathiou, G. 2020, ArXiv e-prints [arXiv:2007.10716] [Google Scholar]
- Font-Ribera, A., Kirkbyc, D., Busca, N., et al. 2014, JCAP, 1405, 027 [Google Scholar]
- Frusciante, N., Peirone, S., Atayde, L., & De Felice, A. 2020, Phys. Rev. D, 101, 064001 [Google Scholar]
- Gaztanaga, E., Cabre, A., & Hui, L. 2009, MNRAS, 399, 1663 [Google Scholar]
- Gil-Marín, H., Percival, W. J., Cuesta, A. J., et al. 2016a, MNRAS, 460, 4210 [NASA ADS] [CrossRef] [Google Scholar]
- Gil-Marín, H., Percival, W. J., Brownstein, J. R., et al. 2016b, MNRAS, 460, 4188 [Google Scholar]
- Gil-Marín, H., Percival, W. J., Verde, L., et al. 2017, MNRAS, 465, 1757 [NASA ADS] [CrossRef] [Google Scholar]
- Gil-Marín, H., Guy, J., Zarrouk, P., et al. 2018, MNRAS, 477, 1604 [NASA ADS] [CrossRef] [Google Scholar]
- Gil-Marín, H., Bautista, J. E., Paviot, R., et al. 2020, MNRAS, 498, 2492 [Google Scholar]
- Handley, W. 2021, Phys. Rev. D, 103, 041301 [Google Scholar]
- Handley, W. J., Hobson, M. P., & Lasenby, A. N. 2015, MNRAS, 450, L61 [Google Scholar]
- Hogg, N. B., Martinelli, M., & Nesseris, S. 2020, JCAP, 12, 019 [Google Scholar]
- Hou, J., Sánchez, A. G., Ross, A. J., et al. 2021, MNRAS, 500, 1201 [Google Scholar]
- Hryczuk, A., & Jodłowski, K. 2020, Phys. Rev. D, 102, 043024 [Google Scholar]
- Icaza-Lizaola, M., Vargas-Magaña, M., Fromenteau, S., et al. 2020, MNRAS, 492, 4189 [Google Scholar]
- Ivanov, M. M., Ali-Haïmoud, Y., & Lesgourgues, J. 2020, Phys. Rev. D, 102, 063515 [Google Scholar]
- Jimenez, R., & Loeb, A. 2002, ApJ, 573, 37 [Google Scholar]
- Kang, J., Gong, Y., Cheng, G., & Chen, X. 2020, Res. Astron. Astrophys., 20, 055 [Google Scholar]
- Kazantzidis, L., & Perivolaropoulos, L. 2018, Phys. Rev. D, 97, 103503 [Google Scholar]
- Kazantzidis, L., & Perivolaropoulos, L. 2019, ArXiv e-prints [arXiv:1907.03176] [Google Scholar]
- Kazantzidis, L., Perivolaropoulos, L., & Skara, F. 2019, Phys. Rev. D, 99, 063537 [Google Scholar]
- Kazin, E. A., Koda, J., Blake, C., et al. 2014, MNRAS, 441, 3524 [Google Scholar]
- Khosravi, N., Baghram, S., Afshordi, N., & Altamirano, N. 2019, Phys. Rev. D, 99, 103526 [Google Scholar]
- Klypin, A., Poulin, V., Prada, F., et al. 2020, ArXiv e-prints [arXiv:2006.14910] [Google Scholar]
- Knox, L., & Millea, M. 2020, Phys. Rev. D, 101, 043533 [Google Scholar]
- Lewis, A. 2019, ArXiv e-prints [arXiv:1910.13970] [Google Scholar]
- Li, E.-K., Du, M., & Xu, L. 2020, MNRAS, 491, 4960 [Google Scholar]
- Liddle, A. R. 2007, MNRAS, 377, L74 [NASA ADS] [Google Scholar]
- Luo, X., Huang, Z., Qian, Q., & Huang, L. 2020, ApJ, 905, 53 [Google Scholar]
- Lyu, K.-F., Stamou, E., & Wang, L.-T. 2021, Phys. Rev. D, 103, 015004 [Google Scholar]
- Martinelli, M., Martins, C. J. A. P., Nesseris, S., et al. 2020, A&A, 644, A80 [Google Scholar]
- Moresco, M. 2015, MNRAS, 450, L16 [Google Scholar]
- Moresco, M., Cimatti, A., Jimenez, R., et al. 2012a, JCAP, 1208, 006 [Google Scholar]
- Moresco, M., Verde, L., Pozzetti, L., Jimenez, R., & Cimatti, A. 2012b, JCAP, 07, 053 [Google Scholar]
- Moresco, M., Pozzetti, L., Cimatti, A., et al. 2016, JCAP, 1605, 014 [Google Scholar]
- Motloch, P., & Hu, W. 2020, Phys. Rev. D, 101, 083515 [Google Scholar]
- Nadathur, S., Woodfinden, A., Percival, W. J., et al. 2020, MNRAS, 499, 4140 [Google Scholar]
- Narimani, A., Scott, D., & Afshordi, N. 2014, JCAP, 1408, 049 [Google Scholar]
- Nesseris, S., Sapone, D., & Sypsas, S. 2020, Phys. Dark Univ., 27, 100413 [Google Scholar]
- Neveux, R., Burtin, E., de Mattia, A., et al. 2020, MNRAS, 499, 210 [Google Scholar]
- Nunes, R. C., & Bernui, A. 2020, Eur. Phys. J. C, 80, 1025 [NASA ADS] [CrossRef] [Google Scholar]
- Nunes, R. C., Yadav, S. K., Jesus, J., & Bernui, A. 2020, MNRAS, 497, 2133 [Google Scholar]
- Oka, A., Saito, S., Nishimichi, T., Taruya, A., & Yamamoto, K. 2014, MNRAS, 439, 2515 [Google Scholar]
- Pellejero-Ibanez, M., Chuang, C.-H., Rubiño-Martín, J. A., et al. 2017, MNRAS, 468, 4116 [Google Scholar]
- Percival, W. J., Reid, B. A., Eisenstein, D. J., et al. 2010, MNRAS, 401, 2148 [Google Scholar]
- Perlmutter, S., Aldering, G., Goldhaber, G., et al. 1999, ApJ, 517, 565 [NASA ADS] [CrossRef] [Google Scholar]
- Planck Collaboration VI. 2020, A&A, 641, A6 [NASA ADS] [CrossRef] [EDP Sciences] [Google Scholar]
- Pogosian, L., Zhao, G.-B., & Jedamzik, K. 2020, ApJ, 904, L17 [Google Scholar]
- Raichoor, A., de Mattia, A., Ross, A. J., et al. 2021, MNRAS, 500, 3254 [Google Scholar]
- Ratsimbazafy, A. L., Loubser, S. I., Crawford, S. M., et al. 2017, MNRAS, 467, 3239 [Google Scholar]
- Riess, A. G., Filippenko, A. V., Challis, P., et al. 1998, ApJ, 116, 1009 [Google Scholar]
- Riess, A. G., Casertano, S., Yuan, W., Macri, L. M., & Scolnic, D. 2019, ApJ, 876, 85 [Google Scholar]
- Roberts, C., Horne, K., Hodson, A. O., & Leggat, A. D. 2017, ArXiv e-prints [arXiv:1711.10369] [Google Scholar]
- Ross, A. J., Samushia, L., Howlett, C., et al. 2015, MNRAS, 449, 835 [Google Scholar]
- Scolnic, D., Jones, D. O., Rest, A., et al. 2018, ApJ, 859, 101 [Google Scholar]
- Sekiguchi, T., & Takahashi, T. 2020, ArXiv e-prints [arXiv:2007.03381] [Google Scholar]
- Seo, H.-J., Ho, S., White, M., et al. 2012, ApJ, 761, 13 [Google Scholar]
- Sridhar, S., Song, Y.-S., Ross, A. J., et al. 2020, ApJ, 904, 69 [Google Scholar]
- Staicova, D., & Stoilov, M. 2016, Mod. Phys. Lett. A, 32, 1750006 [Google Scholar]
- Stern, D., Jimenez, R., Verde, L., Kamionkowski, M., & Stanford, S. A. 2010, JCAP, 1002, 008 [Google Scholar]
- Tamone, A., Raichoor, A., Zhao, C., et al. 2020, MNRAS, 499, 5527 [Google Scholar]
- Tojeiro, R., Ross, A. J., Burden, A., et al. 2014, MNRAS, 440, 2222 [Google Scholar]
- Vagnozzi, S., Di Valentino, E., Gariazzo, S., et al. 2020, ArXiv e-prints [arXiv:2010.02230] [Google Scholar]
- Vagnozzi, S., Loeb, A., & Moresco, M. 2021, ApJ, 908, 84 [Google Scholar]
- Vargas-Magaña, M., Ho, S., Cuesta, A. J., et al. 2018, MNRAS, 477, 1153 [Google Scholar]
- Vasak, D., Kirsch, J., Kehm, D., & Struckmeier, J. 2020, Eur. Phys. J. Plus, 135, A404 [Google Scholar]
- Verde, L., Bernal, J. L., Heavens, A. F., & Jimenez, R. 2017, MNRAS, 467, 731 [NASA ADS] [Google Scholar]
- Wang, Y., Zhao, G.-B., Chuang, C.-H., et al. 2017, MNRAS, 469, 3762 [Google Scholar]
- Wang, Y., Zhao, G.-B., Chuang, C.-H., et al. 2018a, MNRAS, 481, 3160 [Google Scholar]
- Wang, D., Zhao, G.-B., Wang, Y., et al. 2018b, MNRAS, 477, 1528 [NASA ADS] [Google Scholar]
- Wang, Y., Zhao, G.-B., Zhao, C., et al. 2020, MNRAS, 498, 3470 [Google Scholar]
- Wu, W. K., Motloch, P., Hu, W., & Raveri, M. 2020, Phys. Rev. D, 102, 023510 [Google Scholar]
- Yang, W., Di Valentino, E., Pan, S., Basilakos, S., & Paliathanasis, A. 2020, Phys. Rev. D, 102, 063503 [Google Scholar]
- Ye, G., & Piao, Y.-S. 2020, Phys. Rev. D, 101, 083507 [Google Scholar]
- Zhang, X., & Huang, Q.-G. 2021, Phys. Rev. D, 103, 043513 [Google Scholar]
- Zhang, C., Zhang, H., Yuan, S., Zhang, T.-J., & Sun, Y.-C. 2014, Res. Astron. Astrophys., 14, 1221 [Google Scholar]
- Zhao, G.-B., Wang, Y., Saito, S., et al. 2017, MNRAS, 466, 762 [Google Scholar]
- Zhao, G.-B., Wang, Y., Saito, S., et al. 2019, MNRAS, 482, 3497 [Google Scholar]
- Zhao, G.-B., Wang, Y., Taruya, A., et al. 2020, MNRAS, submitted [arXiv:2007.09011] [Google Scholar]
- Zhu, F., Padmanabhan, N., Ross, A. J., et al. 2018, MNRAS, 480, 1096 [Google Scholar]
- Zwane, N., Afshordi, N., & Sorkin, R. D. 2018, Classical Quantum Gravity, 35, 194002 [Google Scholar]
All Tables
Variation in the derived parameters depending on the number of correlated points n.
Constraints at 95% CL errors on the cosmological parameters for the ΛCDM, ΩkΛCDM, and wCDM models.
All Figures
|
Fig. 1. Posterior distribution for ΛCDM with and without a test random covariance matrix with six components. The distribution with covariance matrix gives a slightly bigger error bar, but still very similar to the uncorrelated dataset. |
| In the text | |
|
Fig. 2. Posterior distribution for different measurements with the ΛCDM model with 1σ and 2σ. The BAO refers to the baryon acoustic oscillations dataset from Table 1. The CC dataset refers to cosmic chronometers and SC refers to the Hubble diagram from type Ia supernova, quasars and gamma ray bursts. R19 denotes the Riess 2019 measurement of the Hubble constant as a Gaussian prior. |
| In the text | |
|
Fig. 3. Posterior distribution for wCDM and ΩkΛCDM. Upper panel: Ωk vs. the H0 contour, lower panel: w vs. the H0 contour. The legend is the same as in Fig. 2. |
| In the text | |
Current usage metrics show cumulative count of Article Views (full-text article views including HTML views, PDF and ePub downloads, according to the available data) and Abstracts Views on Vision4Press platform.
Data correspond to usage on the plateform after 2015. The current usage metrics is available 48-96 hours after online publication and is updated daily on week days.
Initial download of the metrics may take a while.