Open Access
Fig. 9.
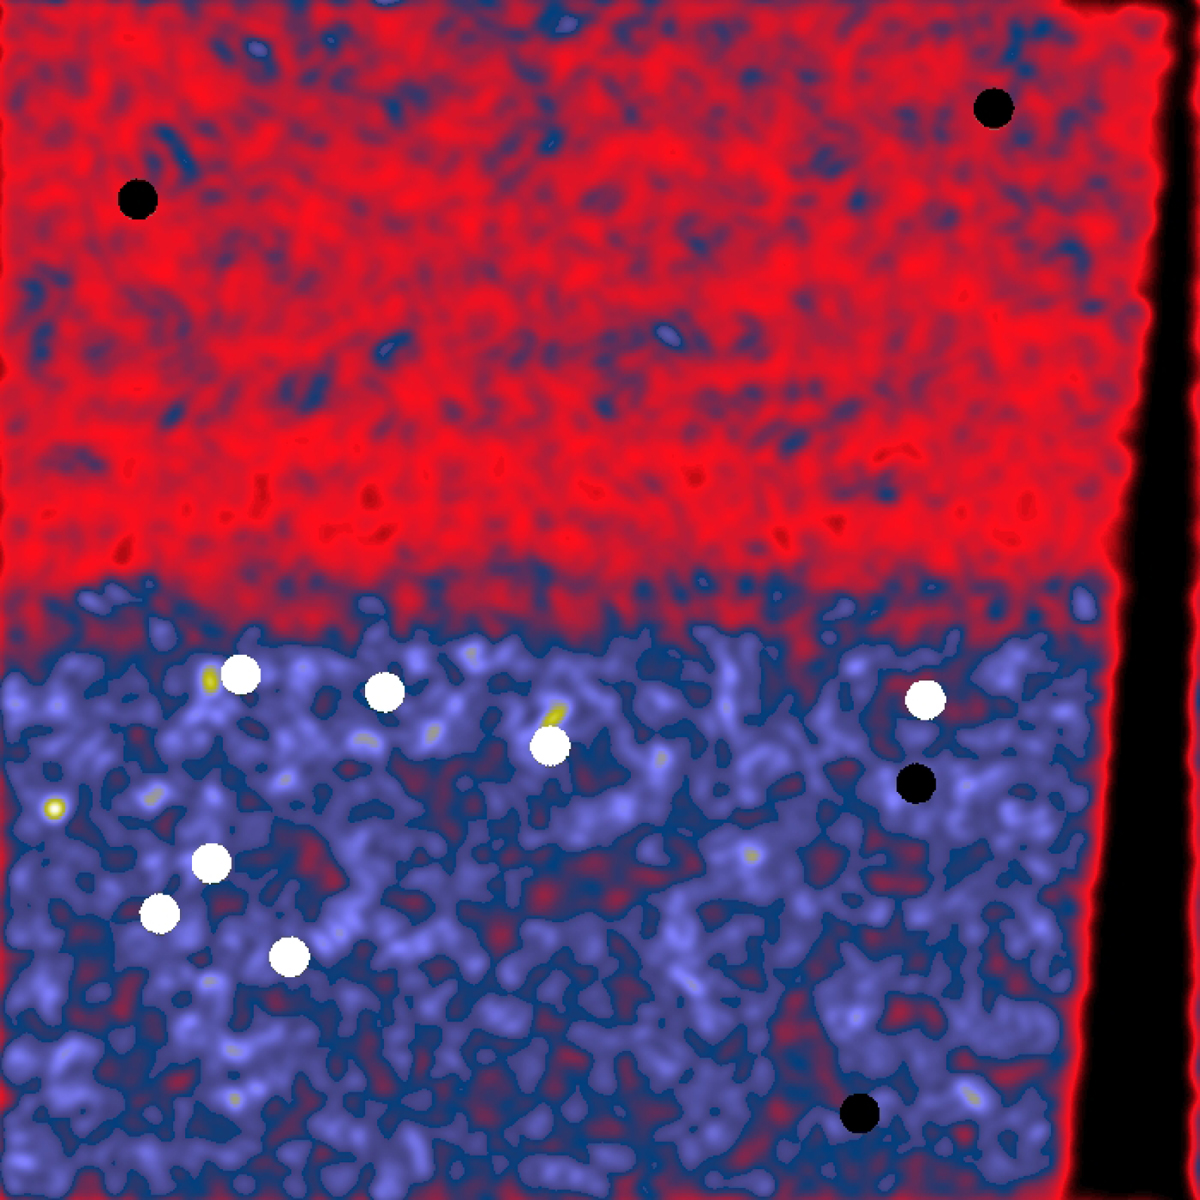
Identified (black disks) and unidentified (white disks) detections in the 10 × 10deg2 tangential map centered on RA = 307.364 deg and Dec = −45.6752 deg. The background image displays the local variance of the instrumental noise at the SPT-SZ 150 GHz frequency, which is higher in the bottom part of the map.
Current usage metrics show cumulative count of Article Views (full-text article views including HTML views, PDF and ePub downloads, according to the available data) and Abstracts Views on Vision4Press platform.
Data correspond to usage on the plateform after 2015. The current usage metrics is available 48-96 hours after online publication and is updated daily on week days.
Initial download of the metrics may take a while.